
Chapter 11: Liquids and Solids
11.5 Phase Diagrams
Learning Outcomes
- Identify physical properties of a substance from its phase diagram
- Use phase diagrams to describe physical changes of substance that undergo pressure and/or temperature changes
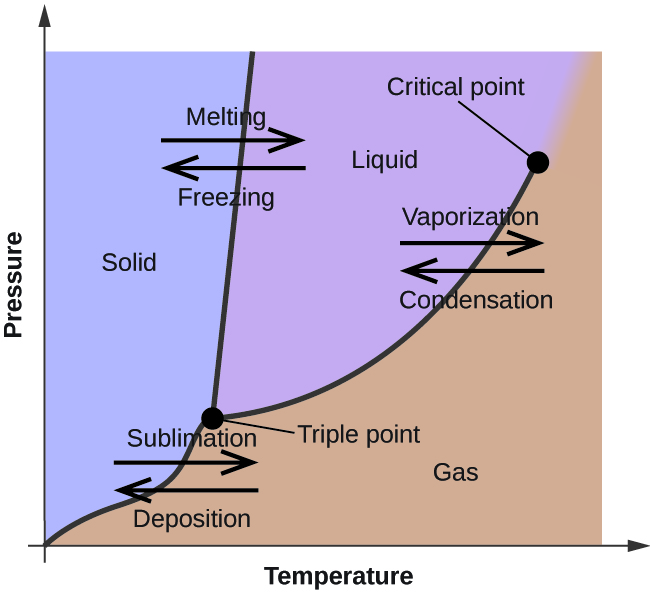
In the previous section, the variation of a liquid’s equilibrium vapor pressure with temperature was described. Considering the definition of boiling point, plots of vapor pressure versus temperature represent how the boiling point of the liquid varies with pressure. Also described was the use of heating and cooling curves to determine a substance’s melting (or freezing) point. Making such measurements over a wide range of pressures yields data that may be presented graphically as a phase diagram. A phase diagram combines plots of pressure versus temperature for the liquid-gas, solid-liquid, and solid-gas phase-transition equilibria of a substance. These diagrams indicate the physical states that exist under specific conditions of pressure and temperature, and also provide the pressure dependence of the phase-transition temperatures (melting points, sublimation points, boiling points). A typical phase diagram for a pure substance is shown in Figure 11.5.1.
To illustrate the utility of these plots, consider the phase diagram for water shown in Figure 11.5.2.

We can use the phase diagram to identify the physical state of a sample of water under specified conditions of pressure and temperature. For example, a pressure of 50 kPa and a temperature of -10 °C correspond to the region of the diagram labeled “ice.” Under these conditions, water exists only as a solid (ice). A pressure of 50 kPa and a temperature of 50 °C correspond to the “water” region—here, water exists only as a liquid. At 25 kPa and 200 °C, water exists only in the gaseous state. Note that on the [latex]\ce{H2O}[/latex] phase diagram, the pressure and temperature axes are not drawn to a constant scale in order to permit the illustration of several important features as described here.
The curve BC in Figure 11.5.2 is the plot of vapor pressure versus temperature as described in the previous section of this chapter. This “liquid-vapor” curve separates the liquid and gaseous regions of the phase diagram and provides the boiling point for water at any pressure. For example, at 1 atm, the boiling point is 100 °C. Notice that the liquid-vapor curve terminates at a temperature of 374 °C and a pressure of 218 atm, indicating that water cannot exist as a liquid above this temperature, regardless of the pressure. The physical properties of water under these conditions are intermediate between those of its liquid and gaseous phases. This unique state of matter is called a supercritical fluid, a topic that will be described in the next section of this chapter.
The solid-vapor curve, labeled AB in Figure 11.5.2, indicates the temperatures and pressures at which ice and water vapor are in equilibrium. These temperature-pressure data pairs correspond to the sublimation, or deposition, points for water. If we could zoom in on the solid-gas line in Figure 11.5.2, we would see that ice has a vapor pressure of about 0.20 kPa at -10 °C. Thus, if we place a frozen sample in a vacuum with a pressure less than 0.20 kPa, ice will sublime. This is the basis for the “freeze-drying” process often used to preserve foods, such as the ice cream shown in Figure 11.5.3.
The solid-liquid curve labeled BD shows the temperatures and pressures at which ice and liquid water are in equilibrium, representing the melting/freezing points for water. Note that this curve exhibits a slight negative slope (greatly exaggerated for clarity), indicating that the melting point for water decreases slightly as pressure increases. Water is an unusual substance in this regard, as most substances exhibit an increase in melting point with increasing pressure. This behavior is partly responsible for the movement of glaciers, like the one shown in Figure 11.5.4. The bottom of a glacier experiences an immense pressure due to its weight that can melt some of the ice, forming a layer of liquid water on which the glacier may more easily slide.

The point of intersection of all three curves is labeled B in Figure 11.5.2. At the pressure and temperature represented by this point, all three phases of water coexist in equilibrium. This temperature-pressure data pair is called the triple point. At pressures lower than the triple point, water cannot exist as a liquid, regardless of the temperature.
Example 11.5.1: Determining the State of Water
Using the phase diagram for water given in Figure 10.30, determine the state of water at the following temperatures and pressures:
- -10 °C and 50 kPa
- 25 °C and 90 kPa
- 50 °C and 40 kPa
- 80 °C and 5 kPa
- -10 °C and 0.3 kPa
- 50 °C and 0.3 kPa
Show Solution
Using the phase diagram for water, we can determine that the state of water at each temperature and pressure given are as follows:
- solid
- liquid
- liquid
- gas
- solid
- gas
Check Your Learning
Consider the phase diagram for carbon dioxide shown in Figure 11.5.5 as another example. The solid-liquid curve exhibits a positive slope, indicating that the melting point for [latex]\ce{CO2}[/latex] increases with pressure as it does for most substances (water being a notable exception as described previously). Notice that the triple point is well above 1 atm, indicating that carbon dioxide cannot exist as a liquid under ambient pressure conditions. Instead, cooling gaseous carbon dioxide at 1 atm results in its deposition into the solid state. Likewise, solid carbon dioxide does not melt at 1 atm pressure but instead sublimes to yield gaseous [latex]\ce{CO2}[/latex]. Finally, notice that the critical point for carbon dioxide is observed at a relatively modest temperature and pressure in comparison to water.
Example 11.5.2: Determining the State of Carbon Dioxide
Using the phase diagram for carbon dioxide shown in Figure 11.5.5, determine the state of [latex]\ce{CO2}[/latex] at the following temperatures and pressures:
- -30 °C and 2000 kPa
- -60 °C and 1000 kPa
- -60 °C and 100 kPa
- 20 °C and 1500 kPa
- 0 °C and 100 kPa
- 20 °C and 100 kPa
Show Solution
Using the phase diagram for carbon dioxide provided, we can determine that the state of [latex]\ce{CO2}[/latex] at each temperature and pressure given are as follows:
- liquid
- solid
- gas
- liquid
- gas
- gas
Check Your Learning
Supercritical Fluids
If we place a sample of water in a sealed container at 25 °C, remove the air, and let the vaporization-condensation equilibrium establish itself, we are left with a mixture of liquid water and water vapor at a pressure of 0.03 atm. A distinct boundary between the more dense liquid and the less dense gas is clearly observed. As we increase the temperature, the pressure of the water vapor increases, as described by the liquid-gas curve in the phase diagram for water (Figure 11.5.2), and a two-phase equilibrium of liquid and gaseous phases remains. At a temperature of 374 °C, the vapor pressure has risen to 218 atm, and any further increase in temperature results in the disappearance of the boundary between liquid and vapor phases. All of the water in the container is now present in a single phase whose physical properties are intermediate between those of the gaseous and liquid states. This phase of matter is called a supercritical fluid, and the temperature and pressure above which this phase exists is the critical point. Above its critical temperature, a gas cannot be liquefied no matter how much pressure is applied. The pressure required to liquefy a gas at its critical temperature is called the critical pressure. The critical temperatures and critical pressures of some common substances are given in Table 11.5.1.

Like a gas, a supercritical fluid will expand and fill a container, but its density is much greater than typical gas densities, typically being close to those for liquids. Similar to liquids, these fluids are capable of dissolving nonvolatile solutes. They exhibit essentially no surface tension and very low viscosities, however, so they can more effectively penetrate very small openings in a solid mixture and remove soluble components. These properties make supercritical fluids extremely useful solvents for a wide range of applications. For example, supercritical carbon dioxide has become a very popular solvent in the food industry, being used to decaffeinate coffee, remove fats from potato chips, and extract flavor and fragrance compounds from citrus oils. It is nontoxic, relatively inexpensive, and not considered to be a pollutant. After use, the [latex]\ce{CO2}[/latex] can be easily recovered by reducing the pressure and collecting the resulting gas.
Example 11.5.3: The Critical Temperature of Carbon Dioxide
If we shake a carbon dioxide fire extinguisher on a cool day (18 °C), we can hear liquid [latex]\ce{CO2}[/latex] sloshing around inside the cylinder. However, the same cylinder appears to contain no liquid on a hot summer day (35 °C). Explain these observations.
Show Solution
On the cool day, the temperature of the [latex]\ce{CO2}[/latex] is below the critical temperature of [latex]\ce{CO2}[/latex], 304 K or 31 °C (Table 11.5.2), so liquid [latex]\ce{CO2}[/latex] is present in the cylinder. On the hot day, the temperature of the [latex]\ce{CO2}[/latex] is greater than its critical temperature of 31 °C. Above this temperature no amount of pressure can liquefy [latex]\ce{CO2}[/latex] so no liquid [latex]\ce{CO2}[/latex] exists in the fire extinguisher.
Check Your Learning
Key Concepts and Summary
The temperature and pressure conditions at which a substance exists in solid, liquid, and gaseous states are summarized in a phase diagram for that substance. Phase diagrams are combined plots of three pressure-temperature equilibrium curves: solid-liquid, liquid-gas, and solid-gas. These curves represent the relationships between phase-transition temperatures and pressures. The point of intersection of all three curves represents the substance’s triple point—the temperature and pressure at which all three phases are in equilibrium. At pressures below the triple point, a substance cannot exist in the liquid state, regardless of its temperature. The terminus of the liquid-gas curve represents the substance’s critical point, the pressure and temperature above which a liquid phase cannot exist.
Try It
- From the phase diagram for water (Figure 11.5.2), determine the state of water at:
- 35 °C and 85 kPa
- -15 °C and 40 kPa
- -15 °C and 0.1 kPa
- 75 °C and 3 kPa
- 40 °C and 0.1 kPa
- 60 °C and 50 kPa
- What phase changes will take place when water is subjected to varying pressure at a constant temperature of 0.005 °C? At 40 °C? At -40 °C?
Show Selected Solutions
2. At low pressures and 0.005 °C, the water is a gas. As the pressure increases to 4.6 torr, the water becomes a solid; as the pressure increases still more, it becomes a liquid. At 40 °C, water at low pressure is a vapor; at pressures higher than about 75 torr, it converts into a liquid. At -40 °C, water goes from a gas to a solid as the pressure increases above very low values.
Glossary
critical point: temperature and pressure above which a gas cannot be condensed into a liquid
phase diagram: pressure-temperature graph summarizing conditions under which the phases of a substance can exist
supercritical fluid: substance at a temperature and pressure higher than its critical point; exhibits properties intermediate between those of gaseous and liquid states
triple point: temperature and pressure at which the vapor, liquid, and solid phases of a substance are in equilibrium
Licenses and Attributions (Click to expand)
CC licensed content, Shared previously
- Chemistry 2e. Provided by: OpenStax. Located at: https://openstax.org/. License: CC BY: Attribution. License Terms: Access for free at
https://openstax.org/books/chemistry-2e/pages/1-introduction
All rights reserved content
- Supercritical CO2. Authored by: mrmrobin. Located at: https://youtu.be/P9EftqFYaHg. License: Other. License Terms: Standard YouTube License
pressure-temperature graph summarizing conditions under which the phases of a substance can exist
temperature and pressure at which the vapor, liquid, and solid phases of a substance are in equilibrium
substance at a temperature and pressure higher than its critical point; exhibits properties intermediate between those of gaseous and liquid states
temperature and pressure above which a gas cannot be condensed into a liquid
