
Chapter 3: The Quantum-Mechanical Model of the Atom
3.2 Quantum Theory
Learning Outcomes
- Distinguish between line and continuous emission spectra
- Describe the particle nature of light
Blackbody Radiation and the Ultraviolet Catastrophe
The last few decades of the nineteenth century witnessed intense research activity in commercializing newly discovered electric lighting. This required obtaining a better understanding of the distributions of light emitted from various sources being considered. Artificial lighting is usually designed to mimic natural sunlight within the limitations of the underlying technology. Such lighting consists of a range of broadly distributed frequencies that form a continuous spectrum. Figure 3.2.1 shows the wavelength distribution for sunlight. The most intense radiation is in the visible region, with the intensity dropping off rapidly for shorter wavelength ultraviolet (UV) light, and more slowly for longer wavelength infrared (IR) light.
In Figure 3.2.1, the solar distribution is compared to a representative distribution, called a blackbody spectrum, that corresponds to a temperature of 5250 °C. The blackbody spectrum matches the solar spectrum quite well. A blackbody is a convenient, ideal emitter that approximates the behavior of many materials when heated. It is “ideal” in the same sense that an ideal gas is a convenient, simple representation of real gases that works well, provided that the pressure is not too high nor the temperature too low. A good approximation of a blackbody that can be used to observe blackbody radiation is a metal oven that can be heated to very high temperatures. The oven has a small hole allowing for the light being emitted within the oven to be observed with a spectrometer so that the wavelengths and their intensities can be measured. Figure 3.2.2 shows the resulting curves for some representative temperatures. Each distribution depends only on a single parameter: the temperature. The maxima in the blackbody curves, λmax, shift to shorterwavelengths as the temperature increases, reflecting the observation that metals being heated to high temperatures begin to glow a darker red that becomes brighter as the temperature increases, eventually becoming white hot at very high temperatures as the intensities of all of the visible wavelengths become appreciable. This common observation was at the heart of the first paradox that showed the fundamental limitations of classical physics that we will examine.
Physicists derived mathematical expressions for the blackbody curves using well-accepted concepts from the theories of classical mechanics and classical electromagnetism. The theoretical expressions as functions of temperature fit the observed experimental blackbody curves well at longer wavelengths, but showed significant discrepancies at shorter wavelengths. Not only did the theoretical curves not show a peak, they absurdly showed the intensity becoming infinitely large as the wavelength became smaller, which would imply that everyday objects at room temperature should be emitting large amounts of UV light. This became known as the “ultraviolet catastrophe” because no one could find any problems with the theoretical treatment that could lead to such unrealistic short-wavelength behavior. Finally, around 1900, Max Planck derived a theoretical expression for blackbody radiation that fit the experimental observations exactly (within experimental error). Planck developed his theoretical treatment by extending the earlier work that had been based on the premise that the atoms composing the oven vibrated at increasing frequencies (or decreasing wavelengths) as the temperature increased, with these vibrations being the source of the emitted electromagnetic radiation. But where the earlier treatments had allowed the vibrating atoms to have any energy values obtained from a continuous set of energies (perfectly reasonable, according to classical physics), Planck found that by restricting the vibrational energies to discrete values for each frequency, he could derive an expression for blackbody radiation that correctly had the intensity dropping rapidly for the short wavelengths in the UV region.
[latex]E=h\nu[/latex]
The quantity [latex]h[/latex] is a constant now known as Planck’s constant, in his honor. Although Planck was pleased he had resolved the blackbody radiation paradox, he was disturbed that to do so, he needed to assume the vibrating atoms required quantized energies, which he was unable to explain. The value of Planck’s constant is very small, 6.626 × 10⁻³⁴ joule seconds (J s), which helps explain why energy quantization had not been observed previously in macroscopic phenomena.
The Photoelectric Effect
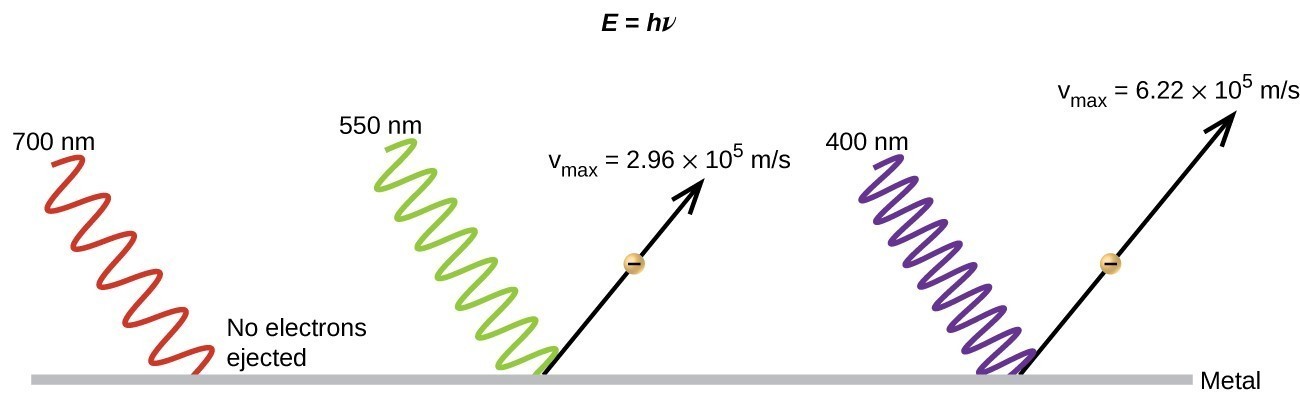
The next paradox in the classical theory to be resolved concerned the photoelectric effect (Figure 3.2.3). It had been observed that electrons could be ejected from the clean surface of a metal when light having a frequency greater than some threshold frequency was shone on it. Surprisingly, the kinetic energy of the ejected electrons did not depend on the brightness of the light, but increased with increasing frequency of the light. Since the electrons in the metal had a certain amount of binding energy keeping them there, the incident light needed to have more energy to free the electrons. According to classical wave theory, a wave’s energy depends on its intensity (which depends on its amplitude), not its frequency. One part of these observations was that the number of electrons ejected within in a given time period was seen to increase as the brightness increased. In 1905, Albert Einstein was able to resolve the paradox by incorporating Planck’s quantization findings into the discredited particle view of light (Einstein actually won his Nobel prize for this work, and not for his theories of relativity for which he is most famous).
Einstein argued that the quantized energies that Planck had postulated in his treatment of blackbody radiation could be applied to the light in the photoelectric effect so that the light striking the metal surface should not be viewed as a wave, but instead as a stream of particles (later called photons) whose energy depended on their frequency, according to Planck’s formula, E = hν (or, in terms of wavelength using c = νλ, [latex]E=\dfrac{hc}{\lambda }[/latex] ). Electrons were ejected when hit by photons having sufficient energy (a frequency greater than the threshold). The greater the frequency, the greater the kinetic energy imparted to the escaping electrons by the collisions. However, the light must have a threshold frequency meaning that the light needs to have a minimum frequency in order for electrons to be ejected. Below this frequency no electrons will be ejected regardless of how intense the light is. Figure 3.2.3 demonstrates the photoelectric effect and having the necessary frequency of light above the threshold frequency. If a higher frequency of light is applied then not only will the electrons be knocked loose but they will also acquire kinetic energy (KE). The following equation summarizes this situation with W being the binding energy of the electron in the metal.
KE= hν-W
With Einstein’s findings, the nature of light took on a new air of mystery. Although many light phenomena could be explained either in terms of waves or particles, certain phenomena, such as the interference patterns obtained when light passed through a double slit, were completely contrary to a particle view of light, while other phenomena, such as the photoelectric effect, were completely contrary to a wave view of light. Somehow, at a deep fundamental level still not fully understood, light is both wavelike and particle-like. This is known as wave-particle duality.

Example 3.2.1: Calculating the Energy of Radiation
When we see light from a neon sign, we are observing radiation from excited neon atoms. If this radiation has a wavelength of 640 nm, what is the energy of the photon being emitted?
Show Solution
We use the part of Planck’s equation that includes the wavelength, λ, and convert units of nanometers to meters so that the units of λ and c are the same.
[latex]\begin{array}{l}E=\dfrac{hc}{\lambda }\\ E=\dfrac{\left(6.626\times {10}^{-34}\text{J}\cancel{\text{s}}\right)\left(2.998\times {10}^{8}\text{m}{\cancel{\text{s}}}^{-1}\right)}{\left(640\cancel{\text{nm}}\right)\left(\dfrac{1\text{m}}{{10}^{9}\cancel{\text{nm}}}\right)}\\ E=3.10\times {10}^{-19}\text{J}\end{array}[/latex]
Check Your Learning
Example 3.2.2: Photoelectric Effect
Identify which of the following statements are false and, where necessary, change the underlined word or phrase to make them true, consistent with Einstein’s explanation of the photoelectric effect.
- Increasing the brightness of incoming light increases the kinetic energy of the ejected electrons.
- Increasing the wavelength of incoming light increases the kinetic energy of the ejected electrons.
- Increasing the brightness of incoming light increases the number of ejected electrons.
- Increasing the frequency of incoming light can increase the number of ejected electrons.
Show Solution
- False. Increasing the brightness of incoming light has no effect on the kinetic energy of the ejected electrons. Only energy, not the number or amplitude, of the photons influences the kinetic energy of the electrons.
- False. Increasing the frequency of incoming light increases the kinetic energy of the ejected electrons. Frequency is proportional to energy and inversely proportional to wavelength. Frequencies above the threshold value transfer the excess energy into the kinetic energy of the electrons.
- True. Because the number of collisions with photons increases with brighter light, the number of ejected electrons increases.
- True with regard to the threshold energy binding the electrons to the metal. Below this threshold, electrons are not emitted and above it they are. Once over the threshold value, further increasing the frequency does not increase the number of ejected electrons
Check Your Learning
Key Concepts and Summary
Electromagnetic radiation also demonstrates properties of particles called photons. The energy of a photon is related to the frequency (or alternatively, the wavelength) of the radiation as E = hν (or [latex]E=\frac{hc}{\lambda }[/latex] ), where h is Planck’s constant. That light demonstrates both wavelike and particle-like behavior is known as wave-particle duality. All forms of electromagnetic radiation share these properties, although various forms including X-rays, visible light, microwaves, and radio waves interact differently with matter and have very different practical applications. Electromagnetic radiation can be generated by exciting matter to higher energies, such as by heating it. The emitted light can be either continuous (incandescent sources like the sun) or discrete (from specific types of excited atoms). Continuous spectra often have distributions that can be approximated as blackbody radiation at some appropriate temperature. The line spectrum of hydrogen can be obtained by passing the light from an electrified tube of hydrogen gas through a prism. This line spectrum was simple enough that an empirical formula called the Rydberg formula could be derived from the spectrum. Three historically important paradoxes from the late 19th and early 20th centuries that could not be explained within the existing framework of classical mechanics and classical electromagnetism were the blackbody problem, the photoelectric effect, and the discrete spectra of atoms. The resolution of these paradoxes ultimately led to quantum theories that superseded the classical theories.
Key Equations
- [latex]c = \lambda\nu[/latex]
- [latex]E=h\nu =\dfrac{hc}{\lambda }[/latex], where h = 6.626 × 10⁻³⁴ J s
- [latex]\dfrac{1}{\lambda }={R}_{\infty }\left(\dfrac{1}{{n}_{1}^{2}}-\dfrac{1}{{n}_{2}^{2}}\right)[/latex]
- KE= hν-W
Try It
- The emission spectrum of cesium contains two lines whose frequencies are (a) 3.45 × 10¹⁴ Hz and (b) 6.53 × 10¹⁴ Hz. What are the wavelengths and energies per photon of the two lines? What color are the lines?
- Photons of infrared radiation are responsible for much of the warmth we feel when holding our hands before a fire. These photons will also warm other objects. How many infrared photons with a wavelength of 1.5 × 10⁻⁶ m must be absorbed by the water to warm a cup of water (175 g) from 25.0 °C to 40 °C?
- The eyes of certain reptiles pass a single visual signal to the brain when the visual receptors are struck by photons of a wavelength of 850 nm. If a total energy of 3.15 × 10⁻¹⁴ J is required to trip the signal, what is the minimum number of photons that must strike the receptor?
Show Solutions
- The wavelengths and energies are as follows:
-
- λ = 8.69 × 10⁻⁷ m; E = 2.29 × 10⁻¹⁹ J
- λ = 4.59 × 10⁻⁷ m; E = 4.33 × 10⁻¹⁹ J
- The color of (a) is red; (b) is blue.
- Energy per photon can be calculated using the formula E = hc / λ where E is energy, h is Planck’s constant, c is the speed of light, and λ is the wavelength.
So the minimum number of photons that must strike the receptor can be found by: 3.15 × 10^-14 J / ( (6.62607015 × 10^-34 Js) * (2.99810^8 m/s) / (850 * 10^-9 m photon) ) = 3.7*10^16 photons
Glossary
amplitude: extent of the displacement caused by a wave (for sinusoidal waves, it is one-half the difference from the peak height to the trough depth, and the intensity is proportional to the square of the amplitude)
blackbody: idealized perfect absorber of all incident electromagnetic radiation; such bodies emit electromagnetic radiation in characteristic continuous spectra called blackbody radiation
continuous spectrum: electromagnetic radiation given off in an unbroken series of wavelengths (e.g., white light from the sun)
electromagnetic radiation: energy transmitted by waves that have an electric-field component and a magnetic-field component
electromagnetic spectrum: range of energies that electromagnetic radiation can comprise, including radio, microwaves, infrared, visible, ultraviolet, X-rays, and gamma rays; since electromagnetic radiation energy is proportional to the frequency and inversely proportional to the wavelength, the spectrum can also be specified by ranges of frequencies or wavelengths
frequency (ν): number of wave cycles (peaks or troughs) that pass a specified point in space per unit time
hertz (Hz): the unit of frequency, which is the number of cycles per second, s−1
intensity: property of wave-propagated energy related to the amplitude of the wave, such as brightness of light or loudness of sound
interference pattern: pattern typically consisting of alternating bright and dark fringes; it results from constructive and destructive interference of waves
line spectrum: electromagnetic radiation emitted at discrete wavelengths by a specific atom (or atoms) in an excited state
node: any point of a standing wave with zero amplitude
photon: smallest possible packet of electromagnetic radiation, a particle of light
quantization: occurring only in specific discrete values, not continuous
standing wave: (also, stationary wave) localized wave phenomenon characterized by discrete wavelengths determined by the boundary conditions used to generate the waves; standing waves are inherently quantized
wave: oscillation that can transport energy from one point to another in space
wavelength (λ): distance between two consecutive peaks or troughs in a wave
wave-particle duality: term used to describe the fact that elementary particles including matter exhibit properties of both particles (including localized position, momentum) and waves (including nonlocalization, wavelength, frequency)
electromagnetic radiation given off in an unbroken series of wavelengths (e.g., white light from the sun)
distance between two consecutive peaks or troughs in a wave
idealized perfect absorber of all incident electromagnetic radiation; such bodies emit electromagnetic radiation in characteristic continuous spectra called blackbody radiation
energy transmitted by waves that have an electric-field component and a magnetic-field component
): number of wave cycles (peaks or troughs) that pass a specified point in space per unit time
occurring only in specific discrete values, not continuous
oscillation that can transport energy from one point to another in space
smallest possible packet of electromagnetic radiation, a particle of light
term used to describe the fact that elementary particles including matter exhibit properties of both particles (including localized position, momentum) and waves (including nonlocalization, wavelength, frequency)
