
Chapter 4: Periodic Properties of the Elements
4.3 Periodic Trends in the Size of Atoms
Link:
https://chem.libretexts.org/Bookshelves/General_Chemistry/Map%3A_A_Molecular_Approach_(Tro)/08%3A_Periodic_Properties_of_the_Elements/8.06%3A_Periodic_Trends_in_the_Size_of_Atoms_and_Effective_Nuclear_Charge
Learning Objectives
- To understand periodic trends in atomic radii.
Although some people fall into the trap of visualizing atoms and ions as small, hard spheres similar to miniature table-tennis balls or marbles, the quantum mechanical model tells us that their shapes and boundaries are much less definite than those images suggest. As a result, atoms and ions cannot be said to have exact sizes; however, some atoms are larger or smaller than others, and this influences their chemistry. In this chapter, we will discuss how atomic and ion “sizes” are defined and obtained.
Atomic Radii
Recall that the probability of finding an electron in the various available orbitals falls off slowly as the distance from the nucleus increases. This point is illustrated in Figure 4.3.1 which shows a plot of total electron density for all occupied orbitals for three noble gases as a function of their distance from the nucleus. Electron density diminishes gradually with increasing distance, which makes it impossible to draw a sharp line marking the boundary of an atom.
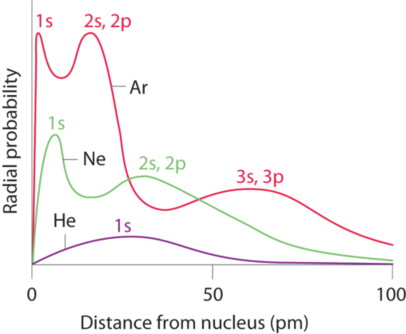
Figure 4.3.1 also shows that there are distinct peaks in the total electron density at particular distances and that these peaks occur at different distances from the nucleus for each element. Each peak in a given plot corresponds to the electron density in a given principal shell. Because helium has only one filled shell (n = 1), it shows only a single peak. In contrast, neon, with filled n = 1 and 2 principal shells, has two peaks. Argon, with filled n = 1, 2, and 3 principal shells, has three peaks. The peak for the filled n = 1 shell occurs at successively shorter distances for neon (Z = 10) and argon (Z = 18) because, with a greater number of protons, their nuclei are more positively charged than that of helium. Because the s2 shell is closest to the nucleus, its electrons are very poorly shielded by electrons in filled shells with larger values of n. Consequently, the two electrons in the n = 1 shell experience nearly the full nuclear charge, resulting in a strong electrostatic interaction between the electrons and the nucleus. The energy of the n = 1 shell also decreases tremendously (the filled s orbital becomes more stable) as the nuclear charge increases. For similar reasons, the filled n = 2 shell in argon is located closer to the nucleus and has a lower energy than the n = 2 shell in neon.
The quantum mechanical picture makes it difficult to establish a definite size of an atom. However, there are several practical ways to define the radius of atoms and, thus, to determine their relative sizes that give roughly similar values. We will use the covalent radius (Figure 4.3.1), which is defined as one-half the distance between the nuclei of two identical atoms when they are joined by a covalent bond (this measurement is possible because atoms within molecules still retain much of their atomic identity). We know that as we scan down a group, the principal quantum number, n, increases by one for each element. Thus, the electrons are being added to a region of space that is increasingly distant from the nucleus. Consequently, the size of the atom (and its covalent radius) must increase as we increase the distance of the outermost electrons from the nucleus. This trend is illustrated for the covalent radii of the halogens in Table 4.3.1 and Figure 4.3.1. The trends for the entire periodic table can be seen in Figure 4.3.1.
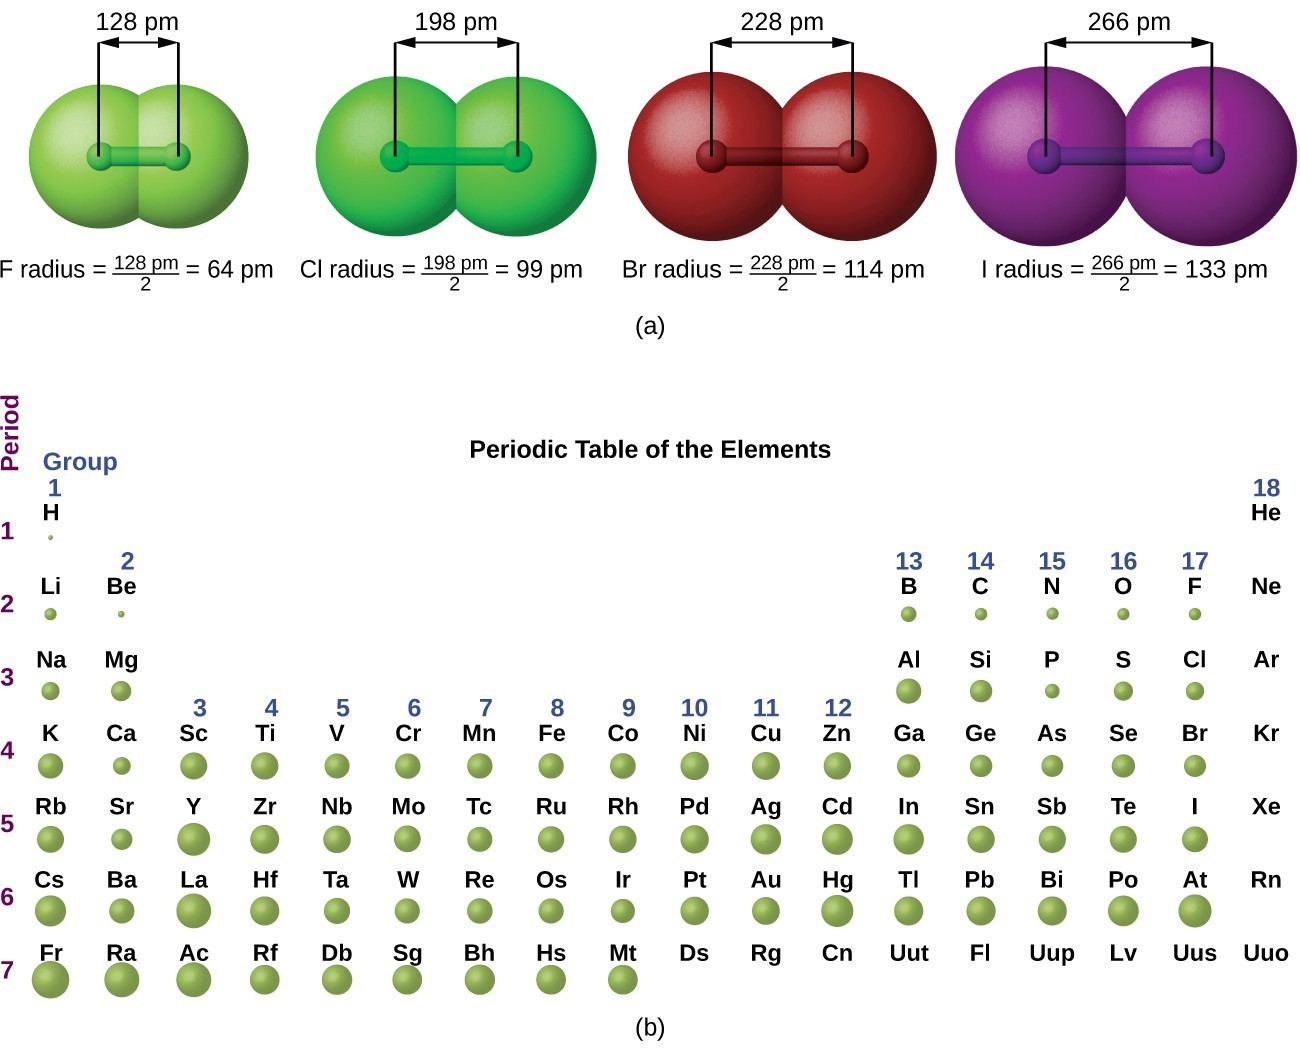
In a similar approach, we can use the lengths of carbon–carbon single bonds in organic compounds, which are remarkably uniform at 154 pm, to assign a value of 77 pm as the covalent atomic radius for carbon. If these values do indeed reflect the actual sizes of the atoms, then we should be able to predict the lengths of covalent bonds formed between different elements by adding them. For example, we would predict a carbon–chlorine distance of 77 pm + 99 pm = 176 pm for a [latex]\ce{C–Cl}[/latex] bond, which is very close to the average value observed in many organochlorine compounds. A similar approach for measuring the size of ions is discussed later in this section.
Covalent atomic radii can be determined for most of the nonmetals, but how do chemists obtain atomic radii for elements that do not form covalent bonds? For these elements, a variety of other methods have been developed. With a metal, for example, the metallic atomic radius (rmet) is defined as half the distance between the nuclei of two adjacent metal atoms in the solid (Figure 4.3.2b). For elements such as the noble gases, most of which form no stable compounds, we can use what is called the van der Waals atomic radius (rvdW), which is half the internuclear distance between two nonbonded atoms in the solid (Figure 4.3.2c). This is somewhat difficult for helium which does not form a solid at any temperature. An atom such as chlorine has both a covalent radius (the distance between the two atoms in a [latex]\ce{Cl2}[/latex] molecule) and a van der Waals radius (the distance between two [latex]\ce{Cl}[/latex] atoms in different molecules in, for example, [latex]\ce{Cl2(s)}[/latex] at low temperatures). These radii are generally not the same (Figure 4.3.2d).
Periodic Trends in Atomic Radii
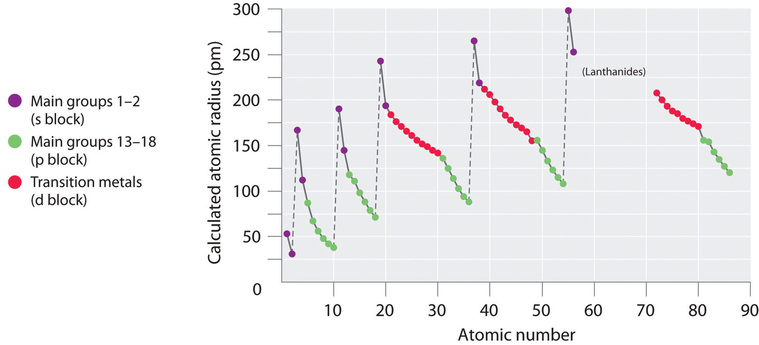
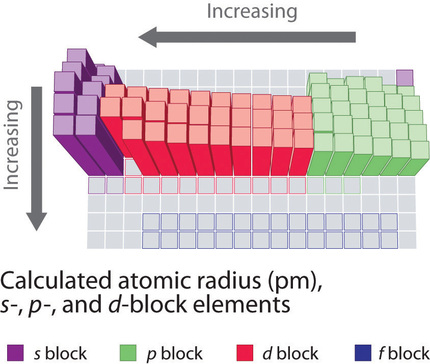
Because it is impossible to measure the sizes of both metallic and nonmetallic elements using any one method, chemists have developed a self-consistent way of calculating atomic radii using the quantum mechanical functions. Although the radii values obtained by such calculations are not identical to any of the experimentally measured sets of values, they do provide a way to compare the intrinsic sizes of all the elements and clearly show that atomic size varies in a periodic fashion (Figure 4.3.3).
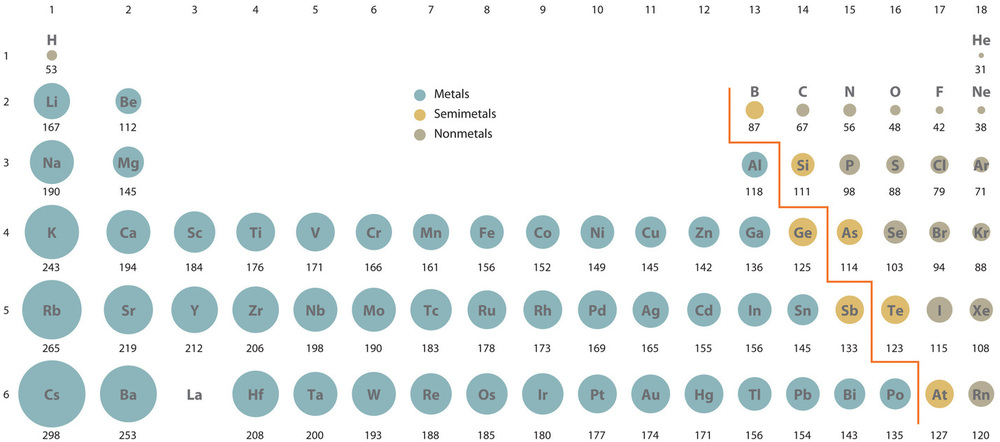
In the periodic table, atomic radii decrease from left to right across a row and increase from top to bottom down a column. Because of these two trends, the largest atoms are found in the lower left corner of the periodic table, and the smallest are found in the upper right corner (Figure 4.3.4).
Trends in atomic size result from differences in the effective nuclear charges (Zeff), which is the magnitude of positive charge that is experienced by electrons in the outermost orbitals of the elements. For all elements except [latex]\ce{H}[/latex], the effective nuclear charge is always less than the actual nuclear charge because of shielding effect, which is the core electrons shielding the outer electrons from the positive pull of the nucleus. The greater the effective nuclear charge, the more strongly the outermost electrons are attracted to the nucleus and the smaller the atomic radius.
The atoms in the second row of the periodic table ([latex]\ce{Li}[/latex] through [latex]\ce{Ne}[/latex]) illustrate the effect of electron shielding. All have a filled s2 inner shell, but as we go from left to right across the row, the nuclear charge increases from +3 to +10. Although electrons are being added to the s and p orbitals, electrons in the same principal shell are not very effective at shielding one another from the nuclear charge. Thus the single s electron in lithium experiences an effective nuclear charge of approximately +1 because the electrons in the filled s2 shell effectively neutralize two of the three positive charges in the nucleus. (More detailed calculations give a value of Zeff = +1.26 for [latex]\ce{Li}[/latex].) In contrast, the two s electrons in beryllium do not shield each other very well, although the filled s2 shell effectively neutralizes two of the four positive charges in the nucleus. This means that the effective nuclear charge experienced by the s electrons in beryllium is between +1 and +2 (the calculated value is +1.66). Consequently, beryllium is significantly smaller than lithium. Similarly, as we proceed across the row, the increasing nuclear charge is not effectively neutralized by the electrons being added to the s and p orbitals. The result is a steady increase in the effective nuclear charge and a steady decrease in atomic size (Figure 4.3.5).
The increase in atomic size going down a column is also due to electron shielding, but the situation is more complex because the principal quantum number n is not constant. As we saw in Chapter 3, the size of the orbitals increases as n increases, provided the nuclear charge remains the same. In group 1, for example, the size of the atoms increases substantially going down the column. It may at first seem reasonable to attribute this effect to the successive addition of electrons to ns orbitals with increasing values of n. However, it is important to remember that the radius of an orbital depends dramatically on the nuclear charge. As we go down the column of the group 1 elements, the principal quantum number n increases from 2 to 6, but the nuclear charge increases from +3 to +55!
As a consequence the radii of the lower electron orbitals in Cesium are much smaller than those in lithium and the electrons in those orbitals experience a much larger force of attraction to the nucleus. That force depends on the effective nuclear charge experienced by the the inner electrons. If the outermost electrons in cesium experienced the full nuclear charge of +55, a cesium atom would be very small indeed. In fact, the effective nuclear charge felt by the outermost electrons in cesium is much less than expected (6 rather than 55). This means that cesium, with a s1 valence electron configuration, is much larger than lithium, with a s1 valence electron configuration. The effective nuclear charge changes relatively little for electrons in the outermost, or valence shell, from lithium to cesium because electrons in filled inner shells are highly effective at shielding electrons in outer shells from the nuclear charge. Even though cesium has a nuclear charge of +55, it has 54 electrons in its filled 1s22s22p63s23p64s23d104p65s24d105p6 shells, abbreviated as [latex]\ce{[Xe]}[/latex]5s24d105p6, which effectively neutralize most of the 55 positive charges in the nucleus. The same dynamic is responsible for the steady increase in size observed as we go down the other columns of the periodic table. Irregularities can usually be explained by variations in effective nuclear charge.
Not all Electrons shield equally
Electrons in the same principal shell are not very effective at shielding one another from the nuclear charge, whereas electrons in filled inner shells are highly effective at shielding electrons in outer shells from the nuclear charge.
Example 4.3.1
On the basis of their positions in the periodic table, arrange these elements in order of increasing atomic radius: aluminum, carbon, and silicon.
Given: three elements
Asked for: arrange in order of increasing atomic radius
Strategy:
- Identify the location of the elements in the periodic table. Determine the relative sizes of elements located in the same column from their principal quantum number n. Then determine the order of elements in the same row from their effective nuclear charges. If the elements are not in the same column or row, use pairwise comparisons.
- List the elements in order of increasing atomic radius.
Solution:
1 These elements are not all in the same column or row, so we must use pairwise comparisons. Carbon and silicon are both in group 14 with carbon lying above, so carbon is smaller than silicon ([latex]\ce{C} < \ce{Si}[/latex]). Aluminum and silicon are both in the third row with aluminum lying to the left, so silicon is smaller than aluminum ([latex]\ce{Si} < \ce{Al}[/latex]) because its effective nuclear charge is greater.
2 Combining the two inequalities gives the overall order: [latex]\ce{C} < \ce{Si} < \ce{Al}[/latex].
Check Your Learning
Key Concepts and Summary
Ionic radii share the same vertical trend as atomic radii, but the horizontal trends differ due to differences in ionic charges. A variety of methods have been established to measure the size of a single atom or ion. The covalent atomic radius (rcov) is half the internuclear distance in a molecule with two identical atoms bonded to each other, whereas the metallic atomic radius (rmet) is defined as half the distance between the nuclei of two adjacent atoms in a metallic element. The van der Waals radius (rvdW) of an element is half the internuclear distance between two nonbonded atoms in a solid. Atomic radii decrease from left to right across a row because of the increase in effective nuclear charge due to poor electron screening by other electrons in the same principal shell. Moreover, atomic radii increase from top to bottom down a column because the effective nuclear charge remains relatively constant as the principal quantum number increases.
Try It
- Based on their positions in the periodic table, predict which has the smallest atomic radius: [latex]\ce{Mg, Sr, Si, Cl, I}[/latex].
- Based on their positions in the periodic table, predict which has the largest atomic radius: [latex]\ce{Li, Rb, N, F, I}[/latex].
- Based on their positions in the periodic table, list the following atoms in order of increasing radius: [latex]\ce{Mg, Ca, Rb, Cs}[/latex].
- Based on their positions in the periodic table, list the following atoms in order of increasing radius: [latex]\ce{Sr, Ca, Si, Cl}[/latex].
Show Solutions
- [latex]\ce{Cl}[/latex]
- [latex]\ce{Mg} < \ce{Ca} < \ce{Rb} < \ce{Cs}[/latex]
Glossary
Covalent radius: is defined as one-half the distance between the nuclei of two identical atoms when they are joined by a covalent bond (this measurement is possible because atoms within molecules still retain much of their atomic identity)
Effective nuclear charges (Zeff): is the magnitude of positive charge that is experienced by electrons in the outermost orbitals of the elements
Metallic atomic radius (rmet) is defined as half the distance between the nuclei of two adjacent metal atoms in the solid
Shielding effect: is the core electrons shielding the outer electrons from the positive pull of the nucleus
Van der Waals atomic radius (rvdW): which is half the internuclear distance between two nonbonded atoms in the solid
Contributors and Attributions
-
Modified by Joshua Halpern (Howard University)
Licenses and Attributions (Click to expand)
CC licensed content, Shared previously
- N/A. Provided by: N/A. Located at: N/A. License: CC BY: Attribution. License Terms: N/A
