
Chapter 11: Liquids and Solids
(Libre clone with Lumen examples) 11.4 Heating Curve for Water
Learning Outcomes
- Analyze a plot of heat transfer versus temperature (i.e. a heating or cooling curve); explain the significance of the slopes and lengths of each segment on the plot
- Calculate the amount of heat transferred along a heating or cooling curve
Freezing, condensation, and deposition, which are the reverse of fusion, sublimation, and vaporization—are exothermic. Thus heat pumps that use refrigerants are essentially air-conditioners running in reverse. Heat from the environment is used to vaporize the refrigerant, which is then condensed to a liquid in coils within a house to provide heat. The energy changes that occur during phase changes can be quantified by using a heating or cooling curve.
Heating Curves
Figure 11.4.1 shows a heating curve, a plot of temperature versus heating time, for a 75 g sample of water. The sample is initially ice at 1 atm and −23°C; as heat is added, the temperature of the ice increases linearly with time. The slope of the line depends on both the mass of the ice and the specific heat (C_s) of ice, which is the number of joules required to raise the temperature of 1 g of ice by 1°C. As the temperature of the ice increases, the water molecules in the ice crystal absorb more and more energy and vibrate more vigorously. At the melting point, they have enough kinetic energy to overcome attractive forces and move with respect to one another. As more heat is added, the temperature of the system does not increase further but remains constant at 0°C until all the ice has melted. Once all the ice has been converted to liquid water, the temperature of the water again begins to increase. Now, however, the temperature increases more slowly than before because the specific heat capacity of water is greater than that of ice. When the temperature of the water reaches 100°C, the water begins to boil. Here, too, the temperature remains constant at 100°C until all the water has been converted to steam. At this point, the temperature again begins to rise, but at a faster rate than seen in the other phases because the heat capacity of steam is less than that of ice or water.

Thus the temperature of a system does not change during a phase change. In this example, as long as even a tiny amount of ice is present, the temperature of the system remains at 0°C during the melting process, and as long as even a small amount of liquid water is present, the temperature of the system remains at 100°C during the boiling process. The rate at which heat is added does not affect the temperature of the ice/water or water/steam mixture because the added heat is being used exclusively to overcome the attractive forces that hold the more condensed phase together. Many cooks think that food will cook faster if the heat is turned up higher so that the water boils more rapidly. Instead, the pot of water will boil to dryness sooner, but the temperature of the water does not depend on how vigorously it boils.
If heat is added at a constant rate, as in Figure 11.4.1, then the length of the horizontal lines, which represents the time during which the temperature does not change, is directly proportional to the magnitude of the enthalpies associated with the phase changes.
In Figure 11.4.1, the horizontal line at 100°C is much longer than the line at 0°C because the enthalpy of vaporization of water is several times greater than the enthalpy of fusion.
A superheated liquid is a sample of a liquid at the temperature and pressure at which it should be a gas. Superheated liquids are not stable; the liquid will eventually boil, sometimes violently. The phenomenon of superheating causes “bumping” when a liquid is heated in the laboratory. When a test tube containing water is heated over a Bunsen burner, for example, one portion of the liquid can easily become too hot. When the superheated liquid converts to a gas, it can push or “bump” the rest of the liquid out of the test tube. Placing a stirring rod or a small piece of ceramic (a “boiling chip”) in the test tube allows bubbles of vapor to form on the surface of the object so the liquid boils instead of becoming superheated. Superheating is the reason a liquid heated in a smooth cup in a microwave oven may not boil until the cup is moved, when the motion of the cup allows bubbles to form.
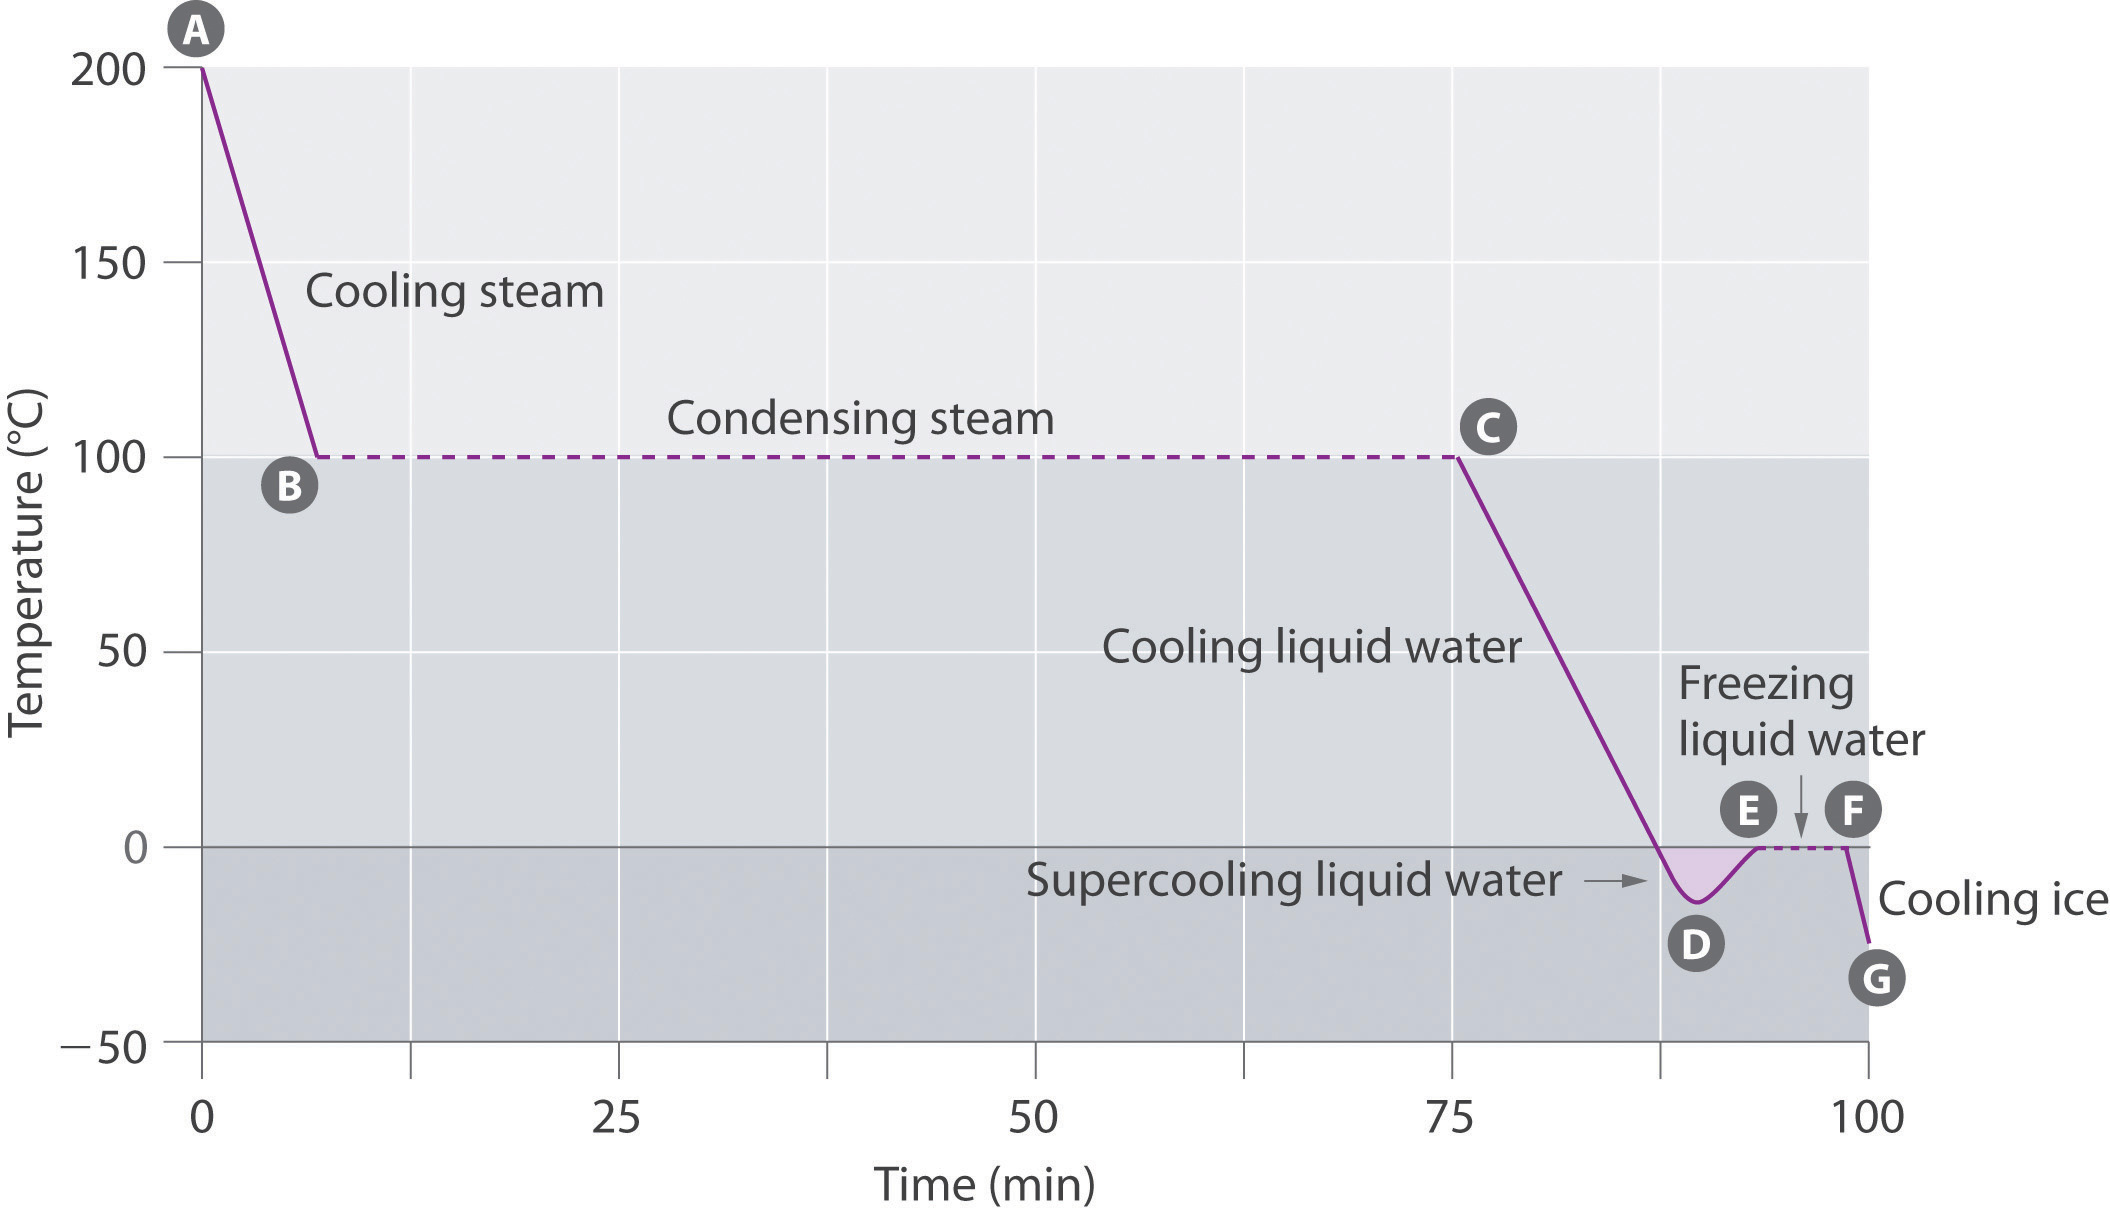
Cooling Curves
The cooling curve, a plot of temperature versus cooling time, in Figure 11.4.2 plots temperature versus time as a 75 g sample of steam, initially at 1 atm and 200°C, is cooled. Although we might expect the cooling curve to be the mirror image of the heating curve in Figure 11.4.1, the cooling curve is not an identical mirror image. As heat is removed from the steam, the temperature falls until it reaches 100°C. At this temperature, the steam begins to condense to liquid water. No further temperature change occurs until all the steam is converted to the liquid; then the temperature again decreases as the water is cooled. We might expect to reach another plateau at 0°C, where the water is converted to ice; in reality, however, this does not always occur. Instead, the temperature often drops below the freezing point for some time, as shown by the little dip in the cooling curve below 0°C. This region corresponds to an unstable form of the liquid, a supercooled liquid. If the liquid is allowed to stand, if cooling is continued, or if a small crystal of the solid phase is added (a seed crystal), the supercooled liquid will convert to a solid, sometimes quite suddenly. As the water freezes, the temperature increases slightly due to the heat evolved during the freezing process and then holds constant at the melting point as the rest of the water freezes. Subsequently, the temperature of the ice decreases again as more heat is removed from the system.
Supercooling effects have a huge impact on Earth’s climate. For example, supercooling of water droplets in clouds can prevent the clouds from releasing precipitation over regions that are persistently arid as a result. Clouds consist of tiny droplets of water, which in principle should be dense enough to fall as rain. In fact, however, the droplets must aggregate to reach a certain size before they can fall to the ground. Usually a small particle (a nucleus) is required for the droplets to aggregate; the nucleus can be a dust particle, an ice crystal, or a particle of silver iodide dispersed in a cloud during seeding (a method of inducing rain). Unfortunately, the small droplets of water generally remain as a supercooled liquid down to about -10°C, rather than freezing into ice crystals that are more suitable nuclei for raindrop formation. One approach to producing rainfall from an existing cloud is to cool the water droplets so that they crystallize to provide nuclei around which raindrops can grow. This is best done by dispersing small granules of solid [latex]\ce{CO_2}[/latex] (dry ice) into the cloud from an airplane. Solid [latex]\ce{CO_2}[/latex] sublimes directly to the gas at pressures of [latex]1 atm[/latex] or lower, and the enthalpy of sublimation is substantial ([latex]25.3 kJ/mol[/latex]). As the [latex]\ce{CO_2}[/latex] sublimes, it absorbs heat from the cloud, often with the desired results.
