
Chapter 18: Kinetics
18.5 Collision Theory and the Effect of Temperature on Reaction Rate
Learning Outcomes
- Use the postulates of collision theory to explain the effects of physical state, temperature, and concentration on reaction rates
- Define the concepts of activation energy and transition state
- Use the Arrhenius equation in calculations relating rate constants to temperature
We should not be surprised that atoms, molecules, or ions must collide before they can react with each other. Atoms must be close together to form chemical bonds. This simple premise is the basis for a very powerful theory that explains many observations regarding chemical kinetics, including factors affecting reaction rates.
Collision theory is based on the following postulates:
- The rate of a reaction is proportional to the rate of reactant collisions: [latex]\text{reaction rate}\propto \dfrac{\#\text{collisions}}{\text{time}}[/latex]
- The reacting species must collide in an orientation that allows contact between the atoms that will become bonded together in the product.
- The collision must occur with adequate energy to permit mutual penetration of the reacting species’ valence shells so that the electrons can rearrange and form new bonds (and new chemical species).
We can see the importance of the two physical factors noted in postulates 2 and 3, the orientation and energy of collisions, when we consider the reaction of carbon monoxide with oxygen:
[latex]\ce{2CO}(g)+\ce{O2}(g)\rightarrow \ce{2CO2}(g)[/latex]
Carbon monoxide is a pollutant produced by the combustion of hydrocarbon fuels. To reduce this pollutant, automobiles have catalytic converters that use a catalyst to carry out this reaction. It is also a side reaction of the combustion of gunpowder that results in muzzle flash for many firearms. If carbon monoxide and oxygen are present in sufficient quantity, the reaction is spontaneous at high temperature and pressure.
The first step in the gas-phase reaction between carbon monoxide and oxygen is a collision between the two molecules:
[latex]\ce{CO}(g)+\ce{O2}(g)\rightarrow\ce{CO2}(g)+\ce{O}(g)[/latex]
Although there are many different possible orientations the two molecules can have relative to each other, consider the two presented in Figure 18.5.1. In the first case, the oxygen side of the carbon monoxide molecule collides with the oxygen molecule. In the second case, the carbon side of the carbon monoxide molecule collides with the oxygen molecule. The second case is clearly more likely to result in the formation of carbon dioxide, which has a central carbon atom bonded to two oxygen atoms [latex]\ce{(O=C=O)}[/latex]. This is a rather simple example of how important the orientation of the collision is in terms of creating the desired product of the reaction.
If the collision does take place with the correct orientation, there is still no guarantee that the reaction will proceed to form carbon dioxide. In addition to a proper orientation, the collision must also occur with sufficient energy to result in product formation. When reactant species collide with both proper orientation and adequate energy, they combine to form an unstable species called an activated complex or a transition state. These species are very short lived and usually undetectable by most analytical instruments. In some cases, sophisticated spectral measurements have been used to observe transition states.
Collision theory explains why most reaction rates increase as concentrations increase. With an increase in the concentration of any reacting substance, the chances for collisions between molecules are increased because there are more molecules per unit of volume. More collisions mean a faster reaction rate, assuming the energy of the collisions is adequate.
Activation Energy and the Arrhenius Equation
The minimum energy necessary to form a product during a collision between reactants is called the activation energy (Ea). The kinetic energy of reactant molecules plays an important role in a reaction because the energy necessary to form a product is provided by a collision of a reactant molecule with another reactant molecule. (In single-reactant reactions, activation energy may be provided by a collision of the reactant molecule with the wall of the reaction vessel or with molecules of an inert contaminant.) If the activation energy is much larger than the average kinetic energy of the molecules, the reaction will occur slowly: Only a few fast-moving molecules will have enough energy to react. If the activation energy is much smaller than the average kinetic energy of the molecules, the fraction of molecules possessing the necessary kinetic energy will be large; most collisions between molecules will result in reaction, and the reaction will occur rapidly.
Figure 18.5.3 shows the energy relationships for the general reaction of a molecule of A with a molecule of B to form molecules of C and D: [latex]A+B\rightarrow C+D[/latex].
These reaction diagrams are widely used in chemical kinetics to illustrate various properties of the reaction of interest. Viewing the diagram from left to right, the system initially comprises reactants only, A + B. Reactant molecules with sufficient energy can collide to form a high-energy activated complex or transition state. The unstable transition state can then subsequently decay to yield stable products, C + D. The diagram depicts the reaction’s activation energy, Ea, as the energy difference between the reactants and the transition state. Using a specific energy, the enthalpy (see chapter on thermochemsitry), the enthalpy change of the reaction, [latex]\Delta[/latex]H, is estimated as the energy difference between the reactants and products. In this case, the reaction is exothermic ([latex]\Delta[/latex]H < 0) since it yields a decrease in system enthalpy.
We can use the Arrhenius equation to relate the activation energy and the rate constant, k, of a given reaction:
[latex]k=A{e}^{-E_{\text{a}}\text{/}RT}[/latex]
In this equation, R is the ideal gas constant, which has a value 8.314 J/mol/K, T is temperature on the Kelvin scale, Ea is the activation energy in joules per mole, e is the constant 2.7183, and A is a constant called the frequency factor, which is related to the frequency of collisions and the orientation of the reacting molecules.
Postulates of collision theory are nicely accommodated by the Arrhenius equation. The frequency factor, A, reflects how well the reaction conditions favor properly oriented collisions between reactant molecules. An increased probability of effectively oriented collisions results in larger values for A and faster reaction rates.
The exponential term, [latex]{e}^{-E_{\text{a}}\text{/}RT}[/latex], describes the effect of activation energy on reaction rate. According to kinetic molecular theory (see the chapter on gases), the temperature of matter is a measure of the average kinetic energy of its constituent atoms or molecules. The distribution of energies among the molecules composing a sample of matter at any given temperature is described by the plot shown in Figure 18.5.4(a). Two shaded areas under the curve represent the numbers of molecules possessing adequate energy (RT) to overcome the activation barriers (Ea). A lower activation energy results in a greater fraction of adequately energized molecules and a faster reaction.
The exponential term also describes the effect of temperature on reaction rate. A higher temperature represents a correspondingly greater fraction of molecules possessing sufficient energy (RT) to overcome the activation barrier (Ea), as shown in Figure 18.5.4(b). This yields a greater value for the rate constant and a correspondingly faster reaction rate.
A convenient approach to determining Ea for a reaction involves the measurement of k at different temperatures and using of an alternate version of the Arrhenius equation that takes the form of linear equation:
[latex]\begin{array}{ccc}\hfill \text{ln }k& =& \left(\dfrac{{-}{E}_{\text{a}}}{R}\right)\left(\dfrac{1}{T}\right)+\text{ln }A\hfill \\ \hfill y& =& mx+b\hfill \end{array}[/latex]
A plot of ln(k) versus [latex]\dfrac{1}{T}[/latex] is linear with the slope [latex]\dfrac{{-}{E}_{\text{a}}}{R}[/latex], from which Ea may be determined. The intercept gives the value of ln(A).
Example 18.5.1: Determination of Ea
The variation of the rate constant with temperature for the decomposition of [latex]\ce{HI}[/latex](g) to [latex]\ce{H2}[/latex](g) and [latex]\ce{I2}[/latex](g) is given below. What is the activation energy for the reaction?
[latex]\ce{2HI}(g)\rightarrow\ce{H2}(g)+\ce{I2}(g)[/latex]
| T (K) | k (L/mol/s) |
|---|---|
| 555 | 3.52 × 10⁻⁷ |
| 575 | 1.22 × 10⁻⁶ |
| 645 | 8.59 × 10⁻⁵ |
| 700 | 1.16 × 10⁻³ |
| 781 | 3.95 × 10⁻² |
Show Solution
Values of [latex]\frac{1}{T}[/latex] and ln k are:
| [latex]\frac{1}{\text{T}}\left({\text{K}}^{-1}\right)[/latex] | ln k |
|---|---|
| 1.80 × 10⁻³ | –14.860 |
| 1.74 × 10⁻³ | –13.617 |
| 1.55 × 10⁻³ | –9.362 |
| 1.43 × 10⁻³ | –6.759 |
| 1.28 × 10⁻³ | –3.231 |
Figure 18.5.5 is a graph of lnk versus [latex]\frac{1}{T}.[/latex]
In practice, the equation of the line (slope and y-intercept) that best fits these plotted data points would be derived using a statistical process called regression. This is helpful for most experimental data because a perfect fit of each data point with the line is rarely encountered. For the data here, the fit is nearly perfect and the slope may be estimated using any two of the provided data pairs. Using the first and last data points permits estimation of the slope.
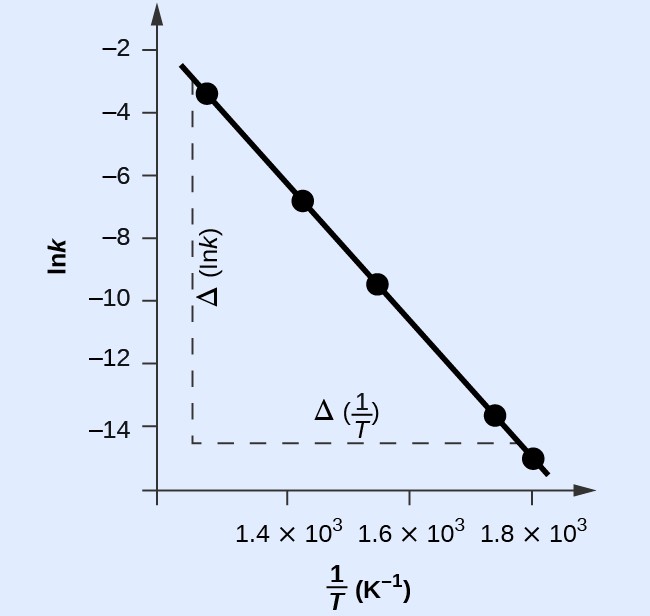
The slope of this line is given by the following expression:
[latex]\begin{array}{cc}\hfill \text{Slope}& =\dfrac{\Delta\left(\mathrm{ln}k\right)}{\Delta\left(\frac{1}{T}\right)}\hfill \\ & =\dfrac{\left(-14.447\right)-\left(-2.593\right)}{\left(1.78\times {10}^{-3}{\text{K}}^{-1}\right)-\left(1.25\times {10}^{-3}{\text{K}}^{-1}\right)}\hfill \\ & =\dfrac{-11.854}{0.53\times {10}^{-3}{\text{K}}^{-1}}=2.2\times {10}^{4}\text{K}\hfill \\ & =-\dfrac{{E}_{\text{a}}}{R}\hfill \end{array}[/latex]
Thus:
Ea = –slope × R = –(–2.2 × 104 K × 8.314 J mol–1 K–1)
Ea = 1.8 × 10⁵ J mol–1
In many situations, it is possible to obtain a reasonable estimate of the activation energy without going through the entire process of constructing the Arrhenius plot. The Arrhenius equation:
[latex]\text{ln}k=\left(\dfrac{{-}{E}_{\text{a}}}{R}\right)\left(\dfrac{1}{T}\right)+\text{ln}A[/latex]
can be rearranged as shown to give:
[latex]\dfrac{\Delta\left(\text{ln}k\right)}{\Delta\left(\frac{1}{T}\right)}=-\dfrac{{E}_{\text{a}}}{R}[/latex]
or
[latex]\text{ln}\dfrac{{k}_{1}}{{k}_{2}}=\dfrac{{E}_{\text{a}}}{R}\left(\dfrac{1}{{T}_{2}}-\dfrac{1}{{T}_{1}}\right)[/latex]
This equation can be rearranged to give a one-step calculation to obtain an estimate for the activation energy:
[latex]{E}_{\text{a}}=-R\left(\dfrac{\text{ln}{k}_{2}-\text{ln}{k}_{1}}{\left(\frac{1}{{T}_{2}}\right)-\left(\frac{1}{{T}_{1}}\right)}\right)[/latex]
Using the experimental data presented below, we can simply select two data entries. For this example, we select the first entry and the last entry:
| T (K) | k (L/mol/s) | [latex]\frac{1}{T}\left({\text{K}}^{-1}\right)[/latex] | lnk |
|---|---|---|---|
| 555 | 3.52 × 10⁻⁷ | 1.80 × 10⁻³ | –14.860 |
| 781 | 3.95 × 10⁻² | 1.28 × 10⁻³ | –3.231 |
After calculating [latex]\dfrac{1}{T}[/latex] and ln k, we can substitute into the equation:
[latex]{E}_{\text{a}}=-8.314\text{J}{\text{mol}}^{-1}{\text{K}}^{-1}\left(\dfrac{-3.231-\left(-14.860\right)}{1.28\times {10}^{-3}{\text{K}}^{-1}-1.80\times {10}^{-3}{\text{K}}^{-1}}\right)[/latex]
and the result is Ea = [latex]1.8\times{10}^{5}\text{ J Mol}^{-1}[/latex] or [latex]180\text{ kJ/mol}[/latex].
This method is very effective, especially when a limited number of temperature-dependent rate constants are available for the reaction of interest.
Check Your Learning
Key Concepts and Summary
Chemical reactions require collisions between reactant species. These reactant collisions must be of proper orientation and sufficient energy in order to result in product formation. Collision theory provides a simple but effective explanation for the effect of many experimental parameters on reaction rates. The Arrhenius equation describes the relation between a reaction’s rate constant and its activation energy, temperature, and dependence on collision orientation.
Key Equations
- [latex]k=A{e}^{{-}{E}_{\text{a}}\text{/}RT}[/latex]
- [latex]\text{ln}k=\left(\dfrac{{-}{E}_{\text{a}}}{R}\right)\left(\dfrac{1}{T}\right)+\text{ln}A[/latex]
- [latex]\text{ln}\dfrac{{k}_{1}}{{k}_{2}}=\dfrac{{E}_{\text{a}}}{R}\left(\dfrac{1}{{T}_{2}}-\dfrac{1}{{T}_{1}}\right)[/latex]
Try It
- The rate constant for the decomposition of acetaldehyde, [latex]\ce{CH3CHO}[/latex], to methane, [latex]\ce{CH4}[/latex], and carbon monoxide, [latex]\ce{CO}[/latex], in the gas phase is 1.1 × 10⁻² L/mol/s at 703 K and 4.95 L/mol/s at 865 K. Determine the activation energy for this decomposition.
Show Selected Solutions
Glossary
activated complex: (also, transition state) unstable combination of reactant species representing the highest energy state of a reaction system
activation energy (Ea): energy necessary in order for a reaction to take place
Arrhenius equation: mathematical relationship between the rate constant and the activation energy of a reaction
collision theory: model that emphasizes the energy and orientation of molecular collisions to explain and predict reaction kinetics
frequency factor (A): proportionality constant in the Arrhenius equation, related to the relative number of collisions having an orientation capable of leading to product formation
Licenses and Attributions (Click to expand)
CC licensed content, Shared previously
- Chemistry 2e. Provided by: OpenStax. Located at: https://openstax.org/. License: CC BY: Attribution. License Terms: Access for free at
https://openstax.org/books/chemistry-2e/pages/1-introduction
model that emphasizes the energy and orientation of molecular collisions to explain and predict reaction kinetics
(also, transition state) unstable combination of reactant species representing the highest energy state of a reaction system
energy necessary in order for a reaction to take place
mathematical relationship between the rate constant and the activation energy of a reaction
proportionality constant in the Arrhenius equation, related to the relative number of collisions having an orientation capable of leading to product formation
