
Chapter 18: Kinetics
18.7 Catalysis
Learning Outcomes
- Identify catalysts in a reaction mechanism
- Describe the impact of catalysts on reaction rates
Among the factors affecting chemical reaction rates discussed earlier in this chapter was the presence of a catalyst, a substance that can increase the reaction rate without being consumed in the reaction. The concepts introduced in the previous section on reaction mechanisms provide the basis for understanding how catalysts are able to accomplish this very important function.
Figure 18.7.1 shows reaction diagrams for a chemical process in the absence and presence of a catalyst. Inspection of the diagrams reveals several traits of these reactions. Consistent with the fact that the two diagrams represent the same overall reaction, both curves begin and end at the same energies (in this case, because products are more energetic than reactants, the reaction is endothermic). The reaction mechanisms, however, are clearly different. The uncatalyzed reaction proceeds via a one-step mechanism (one transition state observed), whereas the catalyzed reaction follows a two-step mechanism (two transition states observed) with a notably lesser activation energy. This difference illustrates the means by which a catalyst functions to accelerate reactions, namely, by providing an alternative reaction mechanism with a lower activation energy. Although the catalyzed reaction mechanism for a reaction needn’t necessarily involve a different number of steps than the uncatalyzed mechanism, it must provide a reaction path whose rate determining step is faster (lower Ea).
Example 18.7.1: Using Reaction Diagrams to Compare Catalyzed Reactions
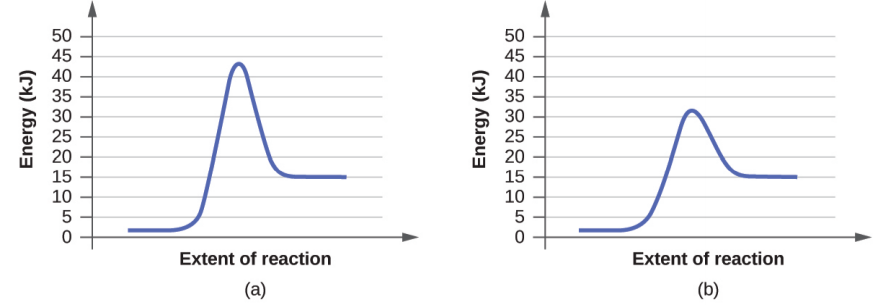
The two reaction diagrams here represent the same reaction: one without a catalyst and one with a catalyst. Estimate the activation energy for each process, and identify which one involves a catalyst.
Show Solution
Activation energies are calculated by subtracting the reactant energy from the transition state energy.
[latex]\text{diagram (a): }{E}_{\text{a}}=32\text{kJ}-6\text{kJ}=26\text{kJ}[/latex]
[latex]\text{diagram (b): }{E}_{\text{a}}=20\text{kJ}-6\text{kJ}=14\text{kJ}[/latex]
The catalyzed reaction is the one with lesser activation energy, in this case represented by diagram (b).
Check Your Learning
Homogeneous Catalysts
A homogeneous catalyst is present in the same phase as the reactants. It interacts with a reactant to form an intermediate substance, which then decomposes or reacts with another reactant in one or more steps to regenerate the original catalyst and form product.
As an important illustration of homogeneous catalysis, consider the earth’s ozone layer. Ozone in the upper atmosphere, which protects the earth from ultraviolet radiation, is formed when oxygen molecules absorb ultraviolet light and undergo the reaction:
[latex]\ce{3O2}(g)\stackrel{hv}{\longrightarrow }\ce{2O3}(g)[/latex]
Ozone is a relatively unstable molecule that decomposes to yield diatomic oxygen by the reverse of this equation. This decomposition reaction is consistent with the following mechanism:
[latex]\begin{array}{l}\\ {\ce{O}}_{3}\rightarrow{\ce{O}}_{2}+\ce{O}\\ \ce{O}+{\ce{O}}_{3}\rightarrow 2{\ce{O}}_{2}\end{array}[/latex]
A number of substances can catalyze the decomposition of ozone. For example, the nitric oxide–catalyzed decomposition of ozone is believed to occur via the following three-step mechanism:
[latex]\begin{array}{l}\ce{NO(}g\text{)}+{\ce{O}}_{3}\text{(}g\text{)}\rightarrow{\ce{NO}}_{2}\text{(}g\text{)}+{\ce{O}}_{2}\text{(}g\text{)}\\ {\ce{O}}_{3}\left(g\right)\rightarrow{\ce{O}}_{2}\left(g\right)+\{O}\left(g\right)\\ {\ce{NO}}_{2}\left(g\right)+\ce{O}\left(g\right)\rightarrow\ce{NO}\left(g\right)+{\ce{O}}_{2}\left(g\right)\end{array}[/latex]
As required, the overall reaction is the same for both the two-step uncatalyzed mechanism and the three-step NO-catalyzed mechanism:
[latex]\ce{2O3}(g)\rightarrow \ce{3O2}(g)[/latex]
Notice that NO is a reactant in the first step of the mechanism and a product in the last step. This is another characteristic trait of a catalyst: Though it participates in the chemical reaction, it is not consumed by the reaction.
Heterogeneous Catalysts
A heterogeneous catalyst is a catalyst that is present in a different phase (usually a solid) than the reactants. Such catalysts generally function by furnishing an active surface upon which a reaction can occur. Gas and liquid phase reactions catalyzed by heterogeneous catalysts occur on the surface of the catalyst rather than within the gas or liquid phase.
Heterogeneous catalysis has at least four steps:
- Adsorption of the reactant onto the surface of the catalyst
- Activation of the adsorbed reactant
- Reaction of the adsorbed reactant
- Diffusion of the product from the surface into the gas or liquid phase (desorption).
Any one of these steps may be slow and thus may serve as the rate determining step. In general, however, in the presence of the catalyst, the overall rate of the reaction is faster than it would be if the reactants were in the gas or liquid phase.
Figure 18.7.2. illustrates the steps that chemists believe to occur in the reaction of compounds containing a carbon–carbon double bond with hydrogen on a nickel catalyst. Nickel is the catalyst used in the hydrogenation of polyunsaturated fats and oils (which contain several carbon–carbon double bonds) to produce saturated fats and oils (which contain only carbon–carbon single bonds).
Many important chemical products are prepared via industrial processes that use heterogeneous catalysts, including ammonia, nitric acid, sulfuric acid, and methanol. Heterogeneous catalysts are also used in the catalytic converters found on most gasoline-powered automobiles Figure 18.7.3.
Key Concepts and Summary
Catalysts affect the rate of a chemical reaction by altering its mechanism to provide a lower activation energy. Catalysts can be homogenous (in the same phase as the reactants) or heterogeneous (a different phase than the reactants).
Try It
- Consider this scenario and answer the following questions: Chlorine atoms resulting from decomposition of chlorofluoromethanes, such as [latex]\ce{CCl2F2}[/latex], catalyze the decomposition of ozone in the atmosphere. One simplified mechanism for the decomposition is:
[latex]\begin{array}{l}{\ce{O}}_{3}\stackrel{\text{sunlight}}{\longrightarrow }{\ce{O}}_{2}+\ce{O}\\ {\ce{O}}_{3}+\ce{Cl}\rightarrow{\ce{O}}_{2}+\ce{ClO}\\ \ce{ClO}+\ce{O}\rightarrow\ce{Cl}+{\ce{O}}_{2}\end{array}[/latex]-
- Explain why chlorine atoms are catalysts in the gas-phase transformation:
[latex]\ce{2O3}\rightarrow \ce{3O2}[/latex] - Nitric oxide is also involved in the decomposition of ozone by the mechanism:
-
- [latex]\begin{array}{l} {\ce{O}}_{3}\stackrel{\text{sunlight}}{\longrightarrow }{\ce{O}}_{2}+\ce{O}\\ {\ce{O}}_{3}+\ce{NO}\rightarrow{\ce{NO}}_{2}+{\ce{O}}_{2}\\ {\ce{NO}}_{2}+\ce{O}\rightarrow\ce{NO}+{\ce{O}}_{2}\end{array}[/latex]
-
- Is [latex]\ce{NO}[/latex] a catalyst for the decomposition? Explain your answer.
- Explain why chlorine atoms are catalysts in the gas-phase transformation:
-
For each of the following pairs of reaction diagrams, identify which of the pair is catalyzed: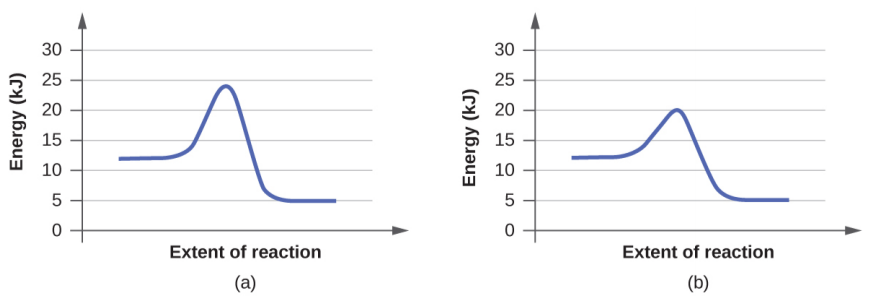
Show Selected Solutions
- The answers are as follows:
- Chlorine atoms are a catalyst because they react in the second step but are regenerated in the third step. Thus, they are not used up, which is a characteristic of catalysts.
- NO is a catalyst for the same reason as in part (a).
Glossary
heterogeneous catalyst: catalyst present in a different phase from the reactants, furnishing a surface at which a reaction can occur
homogeneous catalyst: catalyst present in the same phase as the reactants
Licenses and Attributions (Click to expand)
CC licensed content, Shared previously
- Chemistry 2e. Provided by: OpenStax. Located at: https://openstax.org/. License: CC BY: Attribution. License Terms: Access for free at
https://openstax.org/books/chemistry-2e/pages/1-introduction
catalyst present in the same phase as the reactants
catalyst present in a different phase from the reactants, furnishing a surface at which a reaction can occur
