
Chapter 3: The Quantum-Mechanical Model of the Atom
3.1 Electromagnetic Energy
Learning Outcomes
- Explain the basic behavior of waves, including traveling waves and standing waves
- Describe the wave nature of light
- Use appropriate equations to calculate related light-wave properties such as frequency, wavelength, and energy
- Distinguish between line and continuous emission spectra
- Describe the particle nature of light
- sdfsdf
The nature of light has been a subject of inquiry since antiquity. In the seventeenth century, Isaac Newton performed experiments with lenses and prisms and was able to demonstrate that white light consists of the individual colors of the rainbow combined together. Newton explained his optics findings in terms of a “corpuscular” view of light, in which light was composed of streams of extremely tiny particles travelling at high speeds according to Newton’s laws of motion. Others in the seventeenth century, such as Christiaan Huygens, had shown that optical phenomena such as reflection and refraction could be equally well explained in terms of light as waves travelling at high speed through a medium called “luminiferous aether” that was thought to permeate all space. Early in the nineteenth century, Thomas Young demonstrated that light passing through narrow, closely spaced slits produced interference patterns that could not be explained in terms of Newtonian particles but could be easily explained in terms of waves. Later in the nineteenth century, after James Clerk Maxwell developed his theory of electromagnetic radiation and showed that light was the visible part of a vast spectrum of electromagnetic waves, the particle view of light became thoroughly discredited. By the end of the nineteenth century, scientists viewed the physical universe as roughly comprising two separate domains: matter composed of particles moving according to Newton’s laws of motion, and electromagnetic radiation consisting of waves governed by Maxwell’s equations. Today, these domains are referred to as classical mechanics and classical electrodynamics (or classical electromagnetism). Although there were a few physical phenomena that could not be explained within this framework, scientists at that time were so confident of the overall soundness of this framework that they viewed these aberrations as puzzling paradoxes that would ultimately be resolved somehow within this framework. As we shall see, these paradoxes led to a contemporary framework that intimately connects particles and waves at a fundamental level called wave-particle duality, which has superseded the classical view.
Visible light and other forms of electromagnetic radiation play important roles in chemistry, since they can be used to infer the energies of electrons within atoms and molecules. Much of modern technology is based on electromagnetic radiation. For example, radio waves from a mobile phone, X-rays used by dentists, the energy used to cook food in your microwave, the radiant heat from red-hot objects, and the light from your television screen are forms of electromagnetic radiation that all exhibit wavelike behavior.
Waves
A wave is an oscillation or periodic movement that can transport energy from one point in space to another. Common examples of waves are all around us. Shaking the end of a rope transfers energy from your hand to the other end of the rope, dropping a pebble into a pond causes waves to ripple outward along the water’s surface, and the expansion of air that accompanies a lightning strike generates sound waves (thunder) that can travel outward for several miles. In each of these cases, kinetic energy is transferred through matter (the rope, water, or air) while the matter remains essentially in place. An insightful example of a wave occurs in sports stadiums when fans in a narrow region of seats rise simultaneously and stand with their arms raised up for a few seconds before sitting down again while the fans in neighboring sections likewise stand up and sit down in sequence. While this wave can quickly encircle a large stadium in a few seconds, none of the fans actually travel with the wave-they all stay in or above their seats.
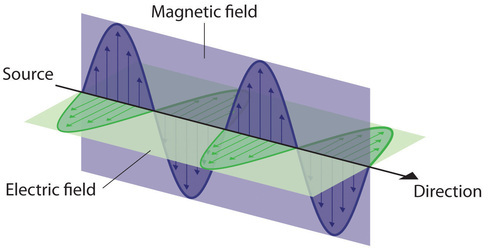
Waves need not be restricted to travel through matter. As Maxwell showed, electromagnetic waves consist of an electric field oscillating in step with a perpendicular magnetic field, both of which are perpendicular to the direction of travel. These waves can travel through a vacuum at a constant speed of 2.998 × 10⁸ m/s, the speed of light (denoted by c).
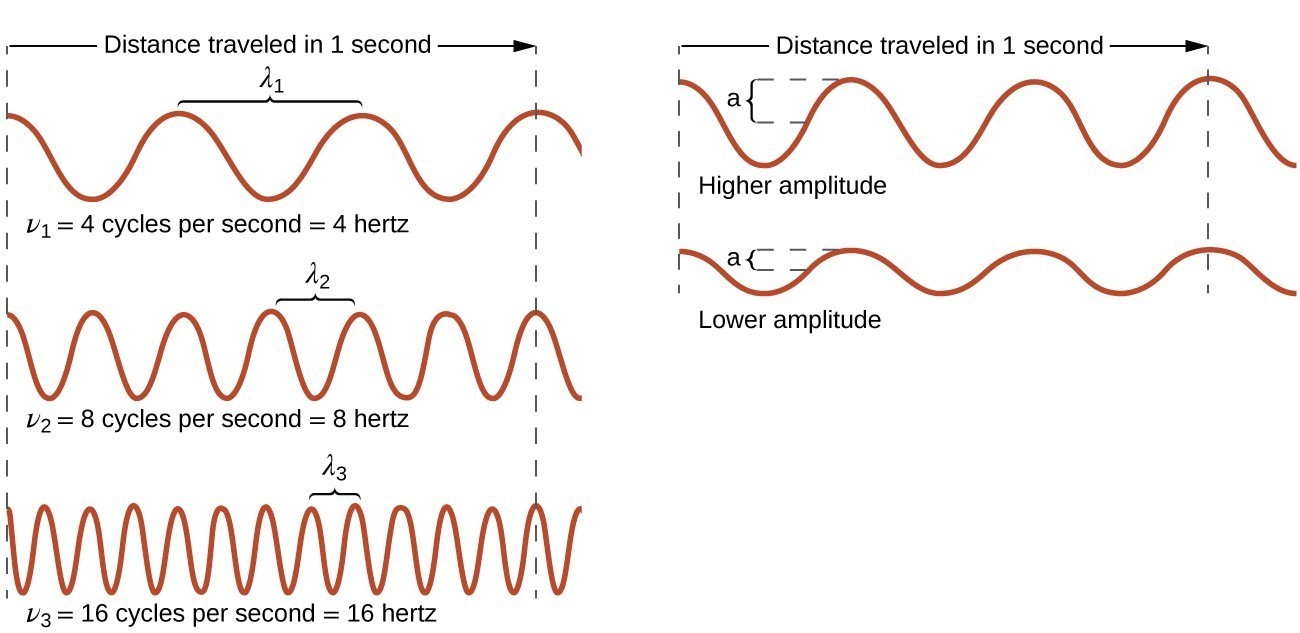
All waves, including forms of electromagnetic radiation, are characterized by a wavelength ([latex]\lambda[/latex]) [latex]\nu[/latex], the lowercase Greek letter nu), and an amplitude. As can be seen in Figure 3.1.1, the wavelength ([latex]\lambda[/latex]) is the distance between two consecutive peaks or troughs in a wave (measured in meters in the SI system). Electromagnetic waves have wavelengths that fall within an enormous range-wavelengths of kilometers (103 m) to picometers (10[latex]-[/latex]12 m) have been observed. The frequency is the number of wave cycles that pass a specified point in space in a specified amount of time (in the SI system, this is measured in seconds). A cycle corresponds to one complete wavelength. The unit for frequency, expressed as cycles per second [s[latex]-[/latex]1], is the hertz (Hz). Common multiples of this unit are megahertz, (1 MHz = 1 × 10⁶ Hz) and gigahertz (1 GHz = 1 × 10⁹ Hz). The amplitude corresponds to the magnitude of the wave’s displacement and so, in Figure 3.1.1, this corresponds to one-half the height between the peaks and troughs. The amplitude is related to the intensity of the wave, which for light is the brightness, and for sound is the loudness.
The product of a wave’s wavelength ([latex]\lambda[/latex]) and its frequency ([latex]\nu[/latex]), [latex]\lambda\nu[/latex], is the speed of the wave. Thus, for electromagnetic radiation in a vacuum, speed is equal to the fundamental constant, [latex]c[/latex]:
[latex]c=2.998\times {10}^{8}{\text{ms}}^{-1}=\lambda \nu[/latex]
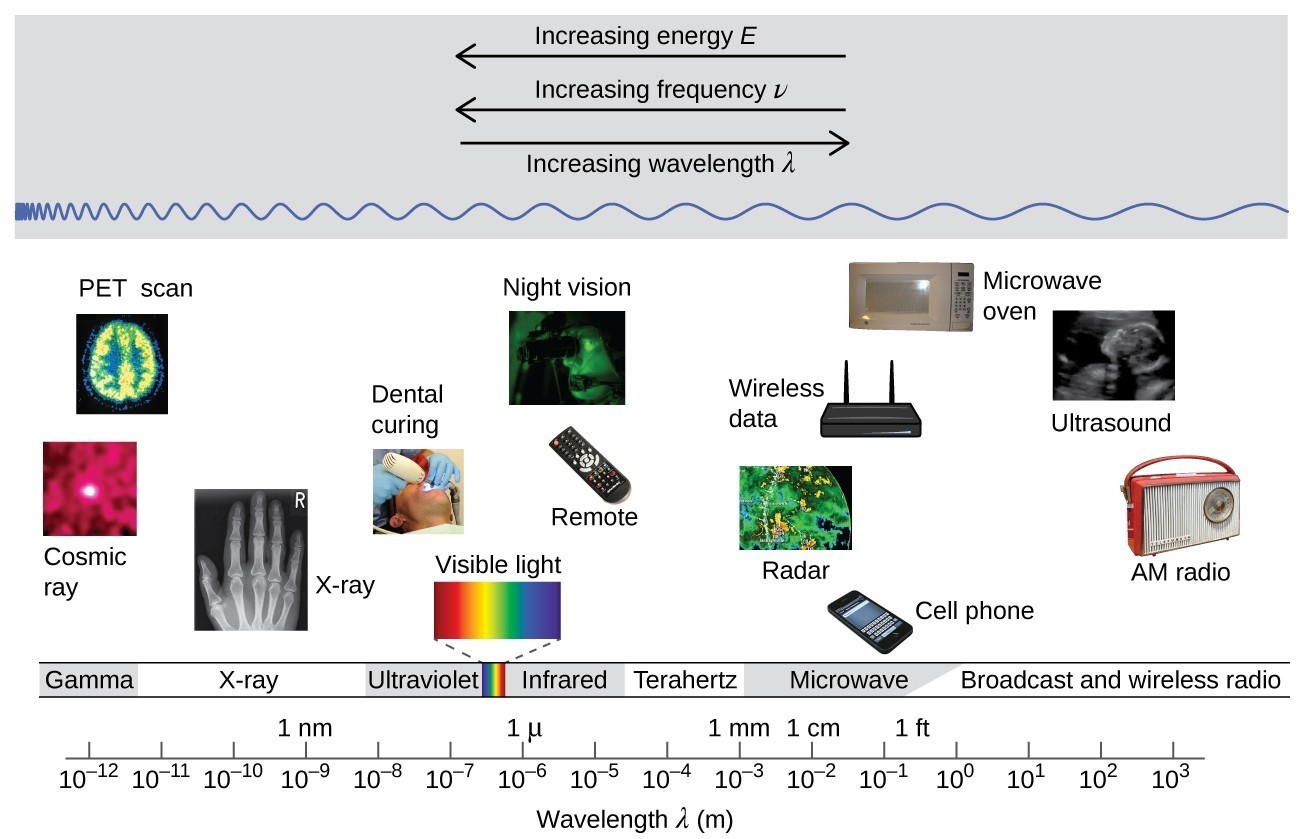
Wavelength and frequency are inversely proportional: As the wavelength increases, the frequency decreases. The inverse proportionality is illustrated in Figure 3.1.3. This figure also shows the electromagnetic spectrum, the range of all types of electromagnetic radiation. Each of the various colors of visible light has specific frequencies and wavelengths associated with them, and you can see that visible light makes up only a small portion of the electromagnetic spectrum. Because the technologies developed to work in various parts of the electromagnetic spectrum are different, for reasons of convenience and historical legacies, different units are typically used for different parts of the spectrum. For example, radio waves are usually specified as frequencies (typically in units of MHz), while the visible region is usually specified in wavelengths (typically in units of nm or angstroms).
Example 3.1.1: Determining the Frequency and Wavelength of Radiation
A sodium streetlight gives off yellow light that has a wavelength of 589 nm (1 nm = 1× 10[latex]-[/latex]9 m). What is the frequency of this light?
Show Solution
We can rearrange the equation c = [latex]\lambda\nu[/latex] to solve for the frequency: [latex]\nu =\frac{c}{\lambda }[/latex]
Since c is expressed in meters per second, we must also convert 589 nm to meters.
[latex]\nu =\left(\dfrac{2.998\times {10}^{8}\cancel{\text{m}}{\text{s}}^{-1}}{589\cancel{\text{nm}}}\right)\left(\dfrac{1\times {10}^{9}\cancel{\text{nm}}}{1\cancel{\text{m}}}\right)=5.09\times {10}^{14}{\text{s}}^{-1}[/latex]
Check Your Learning
One particularly characteristic phenomenon of waves results when two or more waves come into contact: They interfere with each other. Figure 3.1.4 shows the interference patterns that arise when light passes through narrow slits closely spaced about a wavelength apart. The fringe patterns produced depend on the wavelength, with the fringes being more closely spaced for shorter wavelength light passing through a given set of slits. When the light passes through the two slits, each slit effectively acts as a new source, resulting in two closely spaced waves coming into contact at the detector (the camera in this case). The dark regions in Figure 3.1.4 correspond to regions where the peaks for the wave from one slit happen to coincide with the troughs for the wave from the other slit (destructive interference), while the brightest regions correspond to the regions where the peaks for the two waves (or their two troughs) happen to coincide (constructive interference). Likewise, when two stones are tossed close together into a pond, interference patterns are visible in the interactions between the waves produced by the stones. Such interference patterns cannot be explained by particles moving according to the laws of classical mechanics.

Dorothy Hodgkin
Because the wavelengths of X-rays (10-10,000 picometers [pm]) are comparable to the size of atoms, X-rays can be used to determine the structure of molecules. When a beam of X-rays is passed through molecules packed together in a crystal, the X-rays collide with the electrons and scatter. Constructive and destructive interference of these scattered X-rays creates a specific diffraction pattern. Calculating backward from this pattern, the positions of each of the atoms in the molecule can be determined very precisely. One of the pioneers who helped create this technology was Dorothy Crowfoot Hodgkin.
She was born in Cairo, Egypt, in 1910, where her British parents were studying archeology. Even as a young girl, she was fascinated with minerals and crystals. When she was a student at Oxford University, she began researching how X-ray crystallography could be used to determine the structure of biomolecules. She invented new techniques that allowed her and her students to determine the structures of vitamin [latex]\ce{B_{12}}[/latex], penicillin, and many other important molecules. Diabetes, a disease that affects 382 million people worldwide, involves the hormone insulin. Hodgkin began studying the structure of insulin in 1934, but it required several decades of advances in the field before she finally reported the structure in 1969. Understanding the structure has led to better understanding of the disease and treatment options.
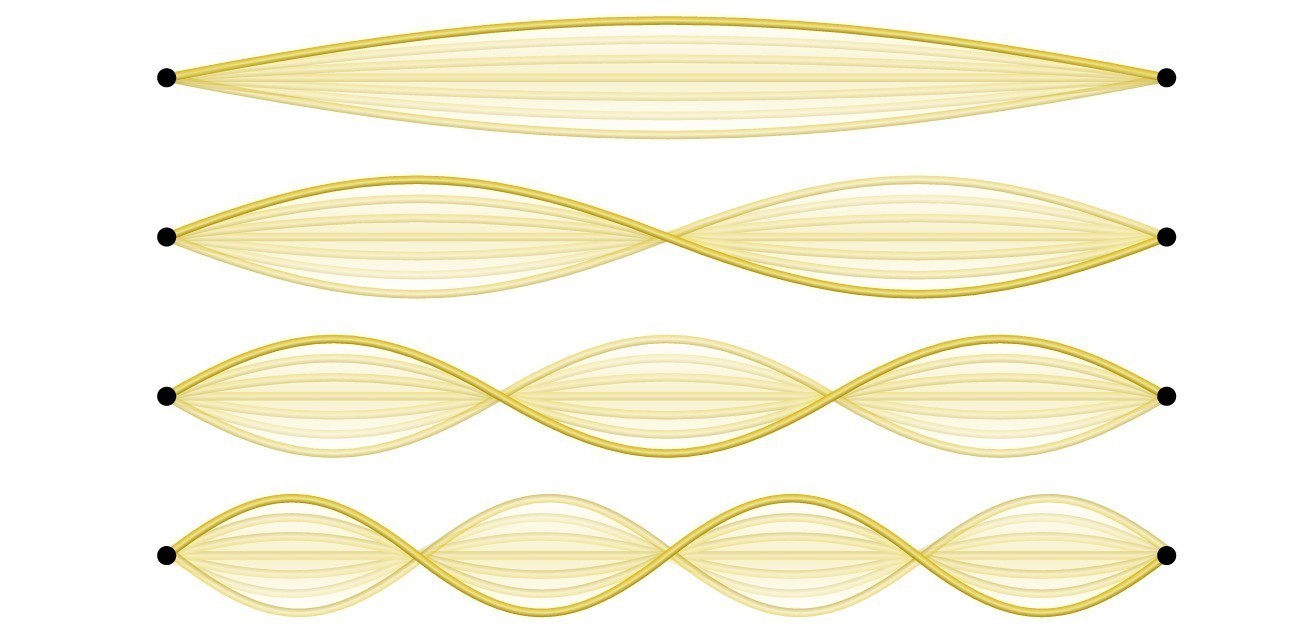
Not all waves are travelling waves. Standing waves (also known as stationary waves) remain constrained within some region of space. As we shall see, standing waves play an important role in our understanding of the electronic structure of atoms and molecules. The simplest example of a standing wave is a one-dimensional wave associated with a vibrating string that is held fixed at its two end points. Although the string’s motion lies mostly within a plane, the wave itself is considered to be one dimensional, since it lies along the length of the string. The motion of string segments in a direction perpendicular to the string length generates the waves and so the amplitude of the waves is visible as the maximum displacement of the curves seen in Figure 3.1.5. The key observation from the figure is that only those waves having an integer number, n, of half-wavelengths between the end points can form. A system with fixed end points such as this restricts the number and type of the possible waveforms. This is an example of quantization, in which only discrete values from a more general set of continuous values of some property are observed. Another important observation is that the harmonic waves (those waves displaying more than one-half wavelength) all have one or more points between the two end points that are not in motion. These special points are nodes. The energies of the standing waves with a given amplitude in a vibrating string increase with the number of half-wavelengths n. Since the number of nodes is n [latex]-[/latex] 1, the energy can also be said to depend on the number of nodes, generally increasing as the number of nodes increases.
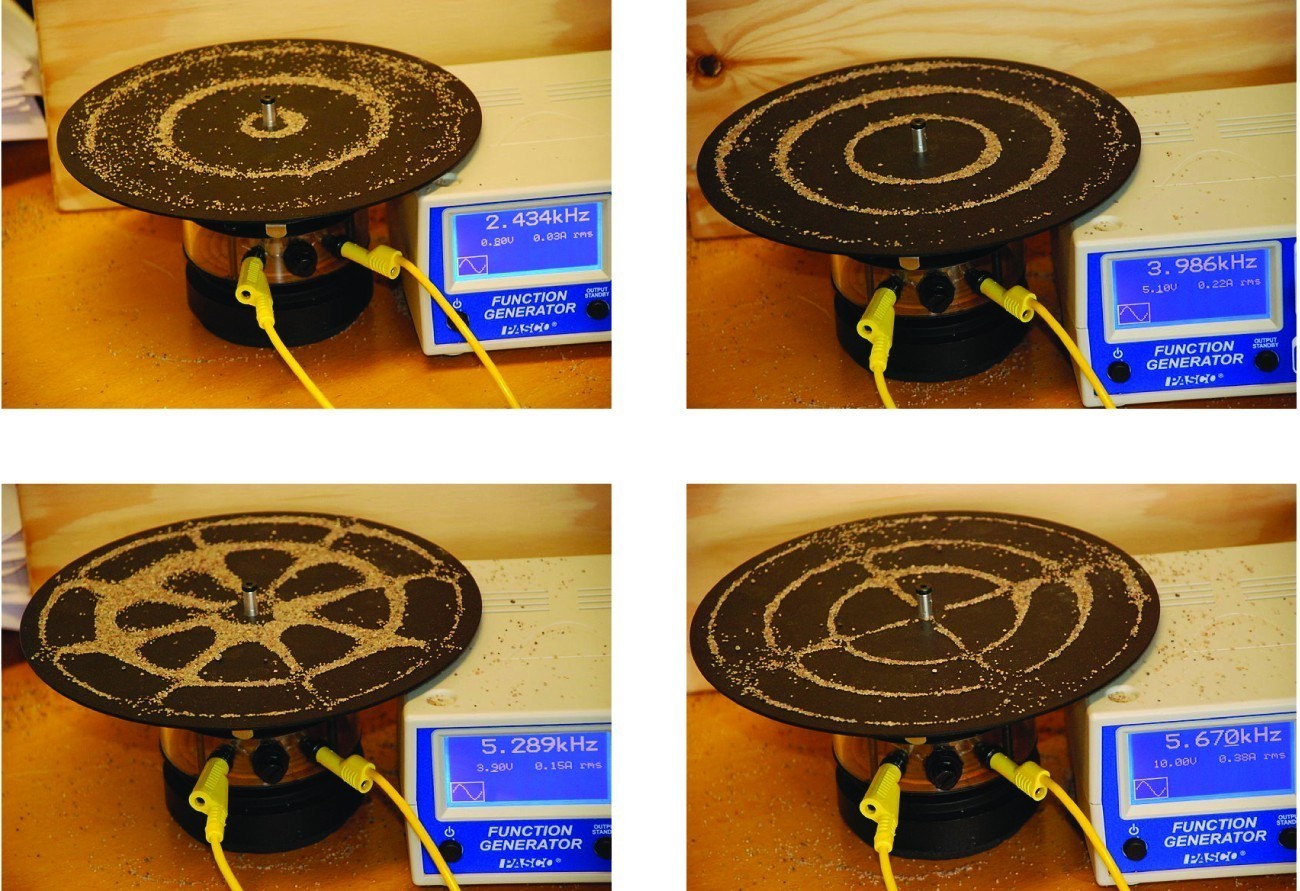
An example of two-dimensional standing waves is shown in Figure 3.1.6, which shows the vibrational patterns on a flat surface. Although the vibrational amplitudes cannot be seen like they could in the vibrating string, the nodes have been made visible by sprinkling the drum surface with a powder that collects on the areas of the surface that have minimal displacement. For one-dimensional standing waves, the nodes were points on the line, but for two-dimensional standing waves, the nodes are lines on the surface (for three-dimensional standing waves, the nodes are two-dimensional surfaces within the three-dimensional volume).
Key Concepts and Summary
Light and other forms of electromagnetic radiation move through a vacuum with a constant speed, c, of 2.998 × 10⁸ m s−1. This radiation shows wavelike behavior, which can be characterized by a frequency, [latex]\nu[/latex], and a wavelength, [latex]\lambda[/latex], such that c = [latex]\lambda\nu[/latex]. Light is an example of a travelling wave. Other important wave phenomena include standing waves, periodic oscillations, and vibrations. Standing waves exhibit quantization, since their wavelengths are limited to discrete integer multiples of some characteristic lengths. Electromagnetic radiation that passes through two closely spaced narrow slits having dimensions roughly similar to the wavelength will show an interference pattern that is a result of constructive and destructive interference of the waves.
Key Equation
- [latex]c = \lambda\nu[/latex]
Try It
- An FM radio station found at 103.1 on the FM dial broadcasts at a frequency of 1.031 × 10⁸ s[latex]-[/latex]1 (103.1 MHz). What is the wavelength of these radio waves in meters?
- A bright violet line occurs at 435.8 nm in the emission spectrum of mercury vapor. What amount of energy, in joules, must be released by an electron in a mercury atom to produce a photon of this light?
- When rubidium ions are heated to a high temperature, two lines are observed in its line spectrum at wavelengths (a) 7.9 × 10[latex]-[/latex]7 m and (b) 4.2 × 10[latex]-[/latex]7 m. What are the frequencies of the two lines? What color do we see when we heat a rubidium compound?
Show Solutions
Glossary
amplitude: extent of the displacement caused by a wave (for sinusoidal waves, it is one-half the difference from the peak height to the trough depth, and the intensity is proportional to the square of the amplitude)
electromagnetic radiation: energy transmitted by waves that have an electric-field component and a magnetic-field component
electromagnetic spectrum: range of energies that electromagnetic radiation can comprise, including radio, microwaves, infrared, visible, ultraviolet, X-rays, and gamma rays; since electromagnetic radiation energy is proportional to the frequency and inversely proportional to the wavelength, the spectrum can also be specified by ranges of frequencies or wavelengths
frequency ([latex]\nu[/latex]): number of wave cycles (peaks or troughs) that pass a specified point in space per unit time
hertz (Hz): the unit of frequency, which is the number of cycles per second, s[latex]-[/latex]1
intensity: property of wave-propagated energy related to the amplitude of the wave, such as brightness of light or loudness of sound
interference pattern: pattern typically consisting of alternating bright and dark fringes; it results from constructive and destructive interference of waves
node: any point of a standing wave with zero amplitude
quantization: occurring only in specific discrete values, not continuous
standing wave: (also, stationary wave) localized wave phenomenon characterized by discrete wavelengths determined by the boundary conditions used to generate the waves; standing waves are inherently quantized
wave: oscillation that can transport energy from one point to another in space
wavelength ([latex]\lambda[/latex]): distance between two consecutive peaks or troughs in a wave
Licenses and Attributions (Click to expand)
CC licensed content, Shared previously
- Chemistry 2e. Provided by: OpenStax. Located at: https://openstax.org/. License: CC BY: Attribution. License Terms: Access for free at
https://openstax.org/books/chemistry-2e/pages/1-introduction
All rights reserved content
- Outrageous acts of science. Standing wave in salt. Authored by: firescience13. Located at: https://youtu.be/gmBYKLyC6Q4. License: Other. License Terms: Standard YouTube License
energy transmitted by waves that have an electric-field component and a magnetic-field component
oscillation that can transport energy from one point to another in space
distance between two consecutive peaks or troughs in a wave
extent of the displacement caused by a wave (for sinusoidal waves, it is one-half the difference from the peak height to the trough depth, and the intensity is proportional to the square of the amplitude)
the unit of frequency, which is the number of cycles per second, s−1
property of wave-propagated energy related to the amplitude of the wave, such as brightness of light or loudness of sound
range of energies that electromagnetic radiation can comprise, including radio, microwaves, infrared, visible, ultraviolet, X-rays, and gamma rays; since electromagnetic radiation energy is proportional to the frequency and inversely proportional to the wavelength, the spectrum can also be specified by ranges of frequencies or wavelengths
pattern typically consisting of alternating bright and dark fringes; it results from constructive and destructive interference of waves
(also, stationary wave) localized wave phenomenon characterized by discrete wavelengths determined by the boundary conditions used to generate the waves; standing waves are inherently quantized
occurring only in specific discrete values, not continuous
any point of a standing wave with zero amplitude
