
Chapter 15: Acid-Based Equilibria
15.7 Acid-Base Titrations
Learning Outcomes
- Interpret titration curves for strong and weak acid-base systems
- Compute sample pH at important stages of a titration
- Explain the function of acid-base indicators
As seen in the chapter on the stoichiometry of chemical reactions, titrations can be used to quantitatively analyze solutions for their acid or base concentrations. In this section, we will explore the underlying chemical equilibria that make acid-base titrimetry a useful analytical technique.
Titration Curve
A titration curve is a plot of some solution property versus the amount of added titrant. For acid-base titrations, solution pH is a useful property to monitor because it varies predictably with the solution composition and, therefore, may be used to monitor the titration’s progress and detect its end point. The following example exercise demonstrates the computation of pH for a titration solution after additions of several specified titrant volumes. The first example involves a strong acid titration that requires only stoichiometric calculations to derive the solution pH. The second example addresses a weak acid titration requiring equilibrium calculations.
Example 15.7.1: Calculating pH for Titration Solutions: Strong Acid/Strong Base
A titration is carried out for 25.00 mL of 0.100 M HCl (strong acid) with 0.100 M of a strong base NaOH the titration curve is shown in Figure 15.7.1 (below). Calculate the pH at these volumes of added base solution:
- 0.00 mL
- 12.50 mL
- 25.00 mL
- 37.50 mL
Show Solution
Since HCl is a strong acid, we can assume that all of it dissociates. The initial concentration of [latex]{\text{H}}_{3}{\text{O}}^{\text{+}}[/latex] is [latex]{\left[{\text{H}}_{3}{\text{O}}^{\text{+}}\right]}_{0}=0.100M[/latex]. When the base solution is added, it also dissociates completely, providing OH− ions. The [latex]{\text{H}}_{3}{\text{O}}^{\text{+}}[/latex] and OH− ions neutralize each other, so only those of the two that were in excess remain, and their concentration determines the pH. Thus, the solution is initially acidic (pH < 7), but eventually all the hydronium ions present from the original acid are neutralized, and the solution becomes neutral. As more base is added, the solution turns basic.
The total initial amount of the hydronium ions is:
[latex]\text{n}{\left({\text{H}}^{\text{+}}\right)}_{0}={\left[{\text{H}}_{3}{\text{O}}^{\text{+}}\right]}_{0}\times \text{0.02500 L}=\text{0.002500 mol}[/latex]
Once X mL of the 0.100-M base solution is added, the number of moles of the OH− ions introduced is:
[latex]\text{n}{\left({\text{OH}}^{-}\right)}_{0}=0.100M\times \text{X mL}\times \left(\frac{\text{1 L}}{\text{1000 mL}}\right)[/latex]
The total volume becomes: [latex]V=\left(\text{25.00 mL}+\text{X mL}\right)\left(\frac{\text{1 L}}{\text{1000 mL}}\right)[/latex]
The number of moles of [latex]{\text{H}}_{3}{\text{O}}^{\text{+}}[/latex] becomes:
[latex]\text{n}\left({\text{H}}^{\text{+}}\right)=\text{n}{\left({\text{H}}^{\text{+}}\right)}_{0}-\text{n}{\left({\text{OH}}^{-}\right)}_{0}=\text{0.002500 mol}-0.100M\times \text{X mL}\times \left(\frac{\text{1 L}}{\text{1000 mL}}\right)[/latex]
The concentration of [latex]{\text{H}}_{3}{\text{O}}^{\text{+}}[/latex] is:
[latex]\begin{array}{l}\\ \\ \left[{\text{H}}_{3}{\text{O}}^{\text{+}}\right]=\dfrac{\text{n}\left({\text{H}}^{\text{+}}\right)}{V}=\dfrac{\text{0.002500 mol}-0.100M\times \text{X mL}\times \left(\frac{\text{1 L}}{\text{1000 mL}}\right)}{\left(\text{25.00 mL}+\text{X mL}\right)\left(\frac{\text{1 L}}{\text{1000 mL}}\right)}\\ =\dfrac{\text{0.002500 mol}\times \left(\frac{\text{1000 mL}}{\text{1 L}}\right)-0.100M\times \text{X mL}}{\text{25.00 mL}+\text{X mL}}\end{array}[/latex]
[latex]\text{pH}=-\text{log}\left(\left[{\text{H}}_{3}{\text{O}}^{\text{+}}\right]\right)[/latex]
The preceding calculations work if [latex]\text{n}{\left({\text{H}}^{\text{+}}\right)}_{0}-\text{n}{\left({\text{OH}}^{-}\right)}_{0}>0[/latex] and so n(H+) > 0. When [latex]\text{n}{\left({\text{H}}^{\text{+}}\right)}_{0}=\text{n}{\left({\text{OH}}^{-}\right)}_{0}[/latex], the [latex]{\text{H}}_{3}{\text{O}}^{\text{+}}[/latex] ions from the acid and the OH− ions from the base mutually neutralize. At this point, the only hydronium ions left are those from the autoionization of water, and there are no OH− particles to neutralize them. Therefore, in this case:
[latex]\left[{\text{H}}_{3}{\text{O}}^{+}\right]=\left[{\text{OH}}^{-}\right],\left[{\text{H}}_{3}{\text{O}}^{+}\right]={K}_{\text{w}}=1.0\times {10}^{\text{-14}};\left[{\text{H}}_{3}{\text{O}}^{+}\right]=1.0\times {10}^{\text{-7}}[/latex]
[latex]\text{pH}=-\text{log}\left(1.0\times {10}^{\text{-7}}\right)=7.00[/latex]
Finally, when [latex]\text{n}{\left({\text{OH}}^{-}\right)}_{0}>\text{n}{\left({\text{H}}^{\text{+}}\right)}_{0}[/latex], there are not enough [latex]{\text{H}}_{3}{\text{O}}^{\text{+}}[/latex] ions to neutralize all the OH− ions, and instead of [latex]\text{n}\left({\text{H}}^{\text{+}}\right)=\text{n}{\left({\text{H}}^{\text{+}}\right)}_{0}-\text{n}{\left({\text{OH}}^{-}\right)}_{0}[/latex], we calculate: [latex]\text{n}\left({\text{OH}}^{-}\right)=\text{n}{\left({\text{OH}}^{-}\right)}_{0}-\text{n}{\left({\text{H}}^{\text{+}}\right)}_{0}[/latex]
In this case:
[latex]\begin{array}{l}\\ \\ \left[{\text{OH}}^{-}\right]=\frac{\text{n}\left({\text{OH}}^{-}\right)}{V}=\frac{0.100M\times \text{X mL}\times \left(\frac{\text{1 L}}{\text{1000 mL}}\right)-\text{0.002500 mol}}{\left(\text{25.00 mL}+\text{X mL}\right)\left(\frac{\text{1 L}}{\text{1000 mL}}\right)}\\ =\frac{0.100M\times \text{X mL}-\text{0.002500 mol}\times \left(\frac{\text{1000 mL}}{\text{1 L}}\right)}{\text{25.00 mL}+\text{X mL}}\end{array}[/latex]
[latex]\text{pH}=14-\text{pOH}=14+\text{log}\left(\left[{\text{OH}}^{-}\right]\right)[/latex]
Let us now consider the four specific cases presented in this problem:
- X = 0 mL
[latex]\left[{\text{H}}_{3}{\text{O}}^{\text{+}}\right]=\frac{\text{n}\left({\text{H}}^{\text{+}}\right)}{V}=\frac{\text{0.002500 mol}\times \left(\frac{\text{1000 mL}}{\text{1 L}}\right)}{\text{25.00 mL}}=0.1M[/latex]pH = −log(0.100) = 1.000 - X = 12.50 mL
[latex]\left[{\text{H}}_{3}{\text{O}}^{\text{+}}\right]=\frac{\text{n}\left({\text{H}}^{\text{+}}\right)}{V}=\frac{\text{0.002500 mol}\times \left(\frac{\text{1000 mL}}{\text{1 L}}\right)-0.100M\times \text{12.50 mL}}{\text{25.00 mL}+\text{12.50 mL}}=0.0333M[/latex]pH = −log(0.0333) = 1.477 - X = 25.00 mL
Since the volumes and concentrations of the acid and base solutions are the same: [latex]\text{n}{\left({\text{H}}^{\text{+}}\right)}_{0}=\text{n}{\left({\text{OH}}^{-}\right)}_{0}[/latex], and pH = 7.000, as described earlier. - X = 37.50 mL
In this case: [latex]\text{n}{\left({\text{OH}}^{-}\right)}_{0}>\text{n}{\left({\text{H}}^{\text{+}}\right)}_{0}[/latex][latex]\left[{\text{OH}}^{-}\right]=\frac{\text{n}\left({\text{OH}}^{-}\right)}{V}=\frac{0.100M\times \text{35.70 mL}-\text{0.002500 mol}\times \left(\frac{\text{1000 mL}}{\text{1 L}}\right)}{\text{25.00 mL}+\text{37.50 mL}}=0.0200M[/latex]pH = 14 − pOH = 14 + log([OH−]) = 14 + log(0.0200) = 12.30
Check Your Learning
In Example 15.7.1, we calculated pH at four points during a titration. Table 15.7.1 shows a detailed sequence of changes in the pH of a strong acid and a weak acid in a titration with NaOH.
| Table 15.7.1. pH Values in the Titrations of a Strong Acid with a Strong Base and of a Weak Acid with a Strong Base | |||
|---|---|---|---|
| Volume of 0.100 M NaOH Added (mL) | Moles of NaOH Added | pH Values 0.100 M HCl[1] | pH Values 0.100 M CH3CO2H[2] |
| 0.0 | 0.0 | 1.00 | 2.87 |
| 5.0 | 0.00050 | 1.18 | 4.14 |
| 10.0 | 0.00100 | 1.37 | 4.57 |
| 15.0 | 0.00150 | 1.60 | 4.92 |
| 20.0 | 0.00200 | 1.95 | 5.35 |
| 22.0 | 0.00220 | 2.20 | 5.61 |
| 24.0 | 0.00240 | 2.69 | 6.13 |
| 24.5 | 0.00245 | 3.00 | 6.44 |
| 24.9 | 0.00249 | 3.70 | 7.14 |
| 25.0 | 0.00250 | 7.00 | 8.72 |
| 25.1 | 0.00251 | 10.30 | 10.30 |
| 25.5 | 0.00255 | 11.00 | 11.00 |
| 26.0 | 0.00260 | 11.29 | 11.29 |
| 28.0 | 0.00280 | 11.75 | 11.75 |
| 30.0 | 0.00300 | 11.96 | 11.96 |
| 35.0 | 0.00350 | 12.22 | 12.22 |
| 40.0 | 0.00400 | 12.36 | 12.36 |
| 45.0 | 0.00450 | 12.46 | 12.46 |
| 50.0 | 0.00500 | 12.52 | 12.52 |
The simplest acid-base reactions are those of a strong acid with a strong base. Table 15.7.1 shows data for the titration of a 25.0-mL sample of 0.100 M hydrochloric acid with 0.100 M sodium hydroxide. The values of the pH measured after successive additions of small amounts of NaOH are listed in the first column of this table, and are graphed in Figure 15.7.1, in a form that is called a titration curve. The pH increases slowly at first, increases rapidly in the middle portion of the curve, and then increases slowly again. The point of inflection (located at the midpoint of the vertical part of the curve) is the equivalence point for the titration. It indicates when equivalent quantities of acid and base are present. For the titration of a strong acid with a strong base, the equivalence point occurs at a pH of 7.00 and the points on the titration curve can be calculated using solution stoichiometry (Table 15.7.1 and Figure 15.7.1).
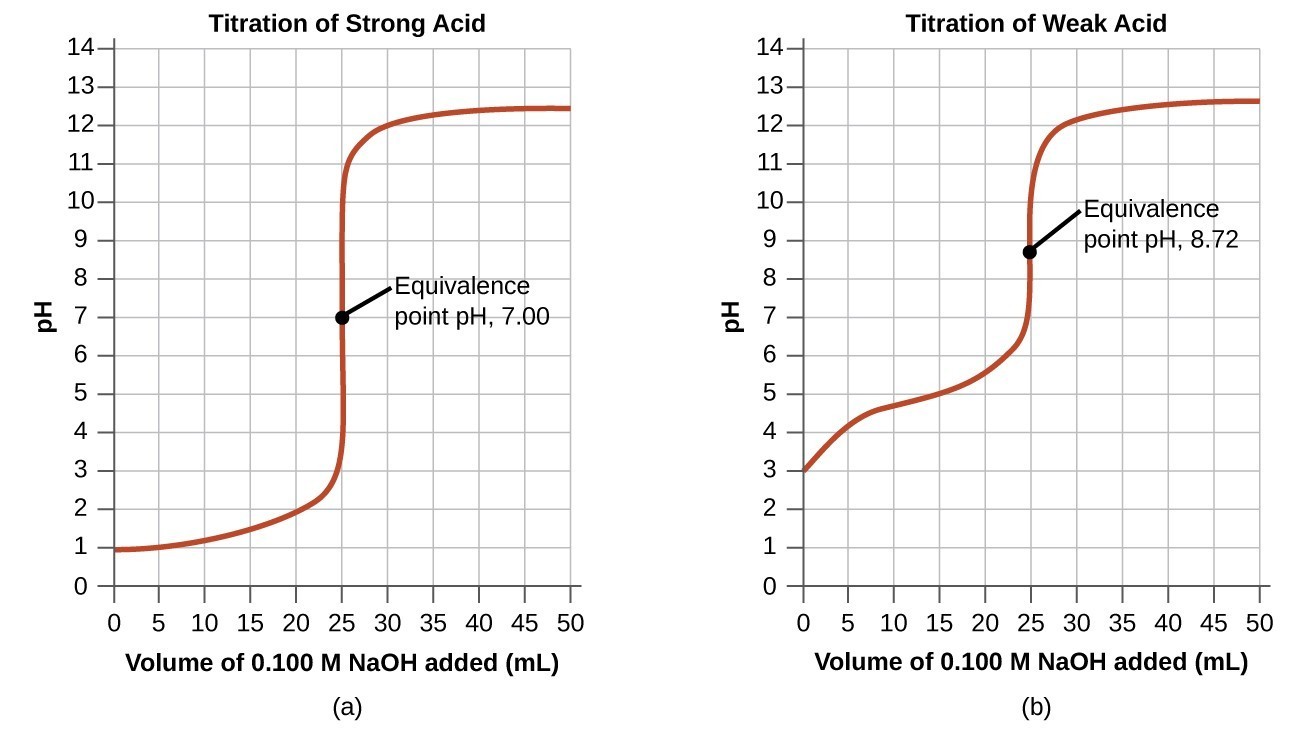
The titration of a weak acid with a strong base (or of a weak base with a strong acid) is somewhat more complicated than that just discussed, but it follows the same general principles. Let us consider the titration of 25.0 mL of 0.100 M acetic acid (a weak acid) with 0.100 M sodium hydroxide and compare the titration curve with that of the strong acid. Table 1 gives the pH values during the titration, Figure 15.7.1 shows the titration curve.
Although the initial volume and molarity of the acids are the same, there are important differences between the two titration curves. The titration curve for the weak acid begins at a higher value (less acidic) and maintains higher pH values up to the equivalence point. This is because acetic acid is a weak acid, which is only partially ionized. The pH at the equivalence point is also higher (8.72 rather than 7.00) due to the hydrolysis of acetate, a weak base that raises the pH:
[latex]{\text{CH}}_{3}{\text{CO}}_{2}{}^{-}\left(aq\right)+{\text{H}}_{2}\text{O}\left(l\right)\rightleftharpoons {\text{CH}}_{3}{\text{CO}}_{2}\text{H}\left(l\right)+{\text{OH}}^{-}\left(aq\right)[/latex]
After the equivalence point, the two curves are identical because the pH is dependent on the excess of hydroxide ion in both cases.
Example 15.7.2: Titration of a Weak Acid with a Strong Base
The titration curve shown in Figure 15.7.4 is for the titration of 25.00 mL of 0.100 M CH3CO2H with 0.100 M NaOH. The reaction can be represented as [latex]{\text{CH}}_{3}{\text{CO}}_{2}\text{H}+{\text{OH}}^{-}\longrightarrow {\text{CH}}_{3}{\text{CO}}_{2}{}^{-}+{\text{H}}_{2}\text{O}[/latex].
- What is the initial pH before any amount of the NaOH solution has been added? Ka = 1.8 [latex]\times[/latex] 10−5 for CH3CO2H.
- Find the pH after 25.00 mL of the NaOH solution have been added.
- Find the pH after 12.50 mL of the NaOH solution has been added.
- Find the pH after 37.50 mL of the NaOH solution has been added.
Show Solution
- Assuming that the dissociated amount is small compared to 0.100 M, we find that:
[latex]{K}_{\text{a}}=\frac{\left[{\text{H}}_{3}{\text{O}}^{\text{+}}\right]\left[{\text{CH}}_{3}{\text{CO}}_{2}{}^{-}\right]}{\left[{\text{CH}}_{3}{\text{CO}}_{2}\text{H}\right]}\approx \frac{{\left[{\text{H}}_{3}{\text{O}}^{\text{+}}\right]}^{\text{2}}}{{\left[{\text{CH}}_{3}{\text{CO}}_{2}\text{H}\right]}_{0}}[/latex], and [latex]\left[{\text{H}}_{3}{\text{O}}^{\text{+}}\right]=\sqrt{{K}_{a}\times \left[{\text{CH}}_{3}{\text{CO}}_{2}\text{H}\right]}=\sqrt{1.8\times {10}^{-5}\times 0.100}=1.3\times {10}^{-3}[/latex][latex]\text{pH}=-\text{log}\left(1.3\times {10}^{-3}\right)=2.87[/latex] - After 25.00 mL of NaOH are added, the number of moles of NaOH and CH3CO2H are equal because the amounts of the solutions and their concentrations are the same. All of the CH3CO2H has been converted to [latex]{\text{CH}}_{3}{\text{CO}}_{2}{}^{-}[/latex]. The concentration of the [latex]{\text{CH}}_{3}{\text{CO}}_{2}{}^{-}[/latex] ion is:[latex]\frac{\text{0.00250 mol}}{\text{0.0500 L}}=\text{0.0500 M}{\text{CH}}_{3}{\text{CO}}_{2}{}^{-}[/latex]The equilibrium that must be focused on now is the basicity equilibrium for [latex]{\text{CH}}_{3}{\text{CO}}_{2}{}^{-}:[/latex][latex]{\text{CH}}_{3}{\text{CO}}_{2}{}^{-}\left(aq\right)+{\text{H}}_{2}\text{O}\left(l\right)\rightleftharpoons {\text{CH}}_{3}{\text{CO}}_{2}\text{H}\left(aq\right)+{\text{OH}}^{-}\left(aq\right)[/latex]so we must determine Kb for the base by using the ion product constant for water:[latex]{K}_{\text{b}}=\frac{\left[{\text{CH}}_{3}{\text{CO}}_{2}\text{H}\right]\left[{\text{OH}}^{-}\right]}{\left[{\text{CH}}_{3}{\text{CO}}_{2}{}^{-}\right]}[/latex][latex]{K}_{\text{a}}=\frac{\left[{\text{CH}}_{3}{\text{CO}}_{2}{}^{-}\right]\left[{\text{H}}^{\text{+}}\right]}{\left[{\text{CH}}_{3}{\text{CO}}_{2}\text{H}\right]},\text{so}\frac{\left[{\text{CH}}_{3}{\text{CO}}_{2}\text{H}\right]}{\left[{\text{CH}}_{3}{\text{CO}}_{2}{}^{-}\right]}=\frac{\left[{\text{H}}^{\text{+}}\right]}{{K}_{\text{a}}}[/latex].Since Kw = [H+][OH−]:[latex]{K}_{\text{b}}=\frac{\left[{\text{H}}^{\text{+}}\right]\left[{\text{OH}}^{-}\right]}{{K}_{\text{a}}}=\frac{{K}_{\text{w}}}{{K}_{\text{a}}}=\frac{1.0\times {10}^{-14}}{1.8\times {10}^{-5}}=5.6\times {10}^{-10}[/latex]Let us denote the concentration of each of the products of this reaction, CH3CO2H and OH−, as x. Using the assumption that x is small compared to 0.0500 M, [latex]{K}_{\text{b}}=\frac{{x}^{\text{2}}}{0.0500M}[/latex], and then:[latex]x=\left[{\text{OH}}^{-}\right]=5.3\times {10}^{-6}[/latex]
[latex]\text{pOH}=-\text{log}\left(5.3\times {10}^{-6}\right)=5.28[/latex]
[latex]\text{pH}=14.00 - 5.28=8.72[/latex]Note that the pH at the equivalence point of this titration is significantly greater than 7. - In (1), 25.00 mL of the NaOH solution was added, and so practically all the CH3CO2H was converted into [latex]{\text{CH}}_{3}{\text{CO}}_{2}{}^{-}[/latex]. In this case, only 12.50 mL of the base solution has been introduced, and so only half of all the CH3CO2H is converted into [latex]{\text{CH}}_{3}{\text{CO}}_{2}{}^{-}[/latex]. The total initial number of moles of CH3CO2H is 0.02500L [latex]\times[/latex] 0.100 M = 0.00250 mol, and so after adding the NaOH, the numbers of moles of CH3CO2H and [latex]{\text{CH}}_{3}{\text{CO}}_{2}{}^{-}[/latex] are both approximately equal to [latex]\frac{\text{0.00250 mol}}{2}=\text{0.00125 mol}[/latex], and their concentrations are the same.Since the amount of the added base is smaller than the original amount of the acid, the equivalence point has not been reached, the solution remains a buffer, and we can use the Henderson-Hasselbalch equation:[latex]\text{pH}=p{K}_{\text{a}}+\text{log}\frac{\left[\text{Base}\right]}{\left[\text{Acid}\right]}=-\text{log}\left({K}_{\text{a}}\right)+\text{log}\frac{\left[{\text{CH}}_{3}{\text{CO}}_{2}{}^{-}\right]}{\left[{\text{CH}}_{3}{\text{CO}}_{2}\text{H}\right]}=-\text{log}\left(1.8\times {10}^{-5}\right)+\text{log}\left(1\right)[/latex](as the concentrations of [latex]{\text{CH}}_{3}{\text{CO}}_{2}{}^{-}[/latex] and CH3CO2H are the same)Thus:[latex]\text{pH}=-\text{log}\left(1.8\times {10}^{-5}\right)=4.74[/latex](the pH = the pKa at the halfway point in a titration of a weak acid)
- After 37.50 mL of NaOH is added, the amount of NaOH is 0.03750 L [latex]\times[/latex] 0.100 M = 0.003750 mol NaOH. Since this is past the equivalence point, the excess hydroxide ions will make the solution basic, and we can again use stoichiometric calculations to determine the pH: [latex]\left[{\text{OH}}^{-}\right]=\frac{\left(\text{0.003750 mol}-\text{0.00250 mol}\right)}{\text{0.06250 L}}=2.00\times {10}^{-2}M[/latex] So: [latex]\text{pOH}=-\text{log}\left(2.00\times {10}^{-2}\right)=\text{1.70, and pH}=14.00 - 1.70=12.30[/latex] Note that this result is the same as for the strong acid-strong base titration example provided, since the amount of the strong base added moves the solution past the equivalence point.
Check Your Learning
Acid-Base Indicators
Certain organic substances change color in dilute solution when the hydronium ion concentration reaches a particular value. For example, phenolphthalein is a colorless substance in any aqueous solution with a hydronium ion concentration greater than 5.0 [latex]\times[/latex] 10−9M (pH < 8.3). In more basic solutions where the hydronium ion concentration is less than 5.0 [latex]\times[/latex] 10−9M (pH > 8.3), it is red or pink. Substances such as phenolphthalein, which can be used to determine the pH of a solution, are called acid-base indicators. Acid-base indicators are either weak organic acids or weak organic bases.
The equilibrium in a solution of the acid-base indicator methyl orange, a weak acid, can be represented by an equation in which we use HIn as a simple representation for the complex methyl orange molecule:
[latex]\begin{array}{ccc}\text{HIn}\left(aq\right)+{\text{H}}_{2}\text{O}\left(l\right)& \rightleftharpoons & {\text{H}}_{3}{\text{O}}^{\text{+}}\left(aq\right)+{\text{In}}^{-}\left(aq\right)\\ \text{red}& &\text{yellow}\end{array}[/latex]
[latex]{K}_{a}=\frac{\left[{\text{H}}_{3}{\text{O}}^{\text{+}}\right]\left[{\text{In}}^{-}\right]}{\left[\text{HIn}\right]}=4.0\times {10}^{-4}[/latex]
The anion of methyl orange, In−, is yellow, and the nonionized form, HIn, is red. When we add acid to a solution of methyl orange, the increased hydronium ion concentration shifts the equilibrium toward the nonionized red form, in accordance with Le Châtelier’s principle. If we add base, we shift the equilibrium towards the yellow form. This behavior is completely analogous to the action of buffers.
The perceived color of an indicator solution is determined by the ratio of the concentrations of the two species In− and HIn. If most of the indicator (typically about 60−90% or more) is present as In−, the perceived color of the solution is yellow. If most is present as HIn, then the solution color appears red. The Henderson-Hasselbalch equation is useful for understanding the relationship between the pH of an indicator solution and its composition (thus, perceived color):
[latex]\text{pH} = \text{p}Ka + \text{log}(\frac{[\text{In}^-]}{[\text{HIn}]})[/latex]
In solutions where pH > pKa, the logarithmic term must be positive, indicating an excess of the conjugate base form of the indicator (yellow solution). When pH < pKa, the log term must be negative, indicating an excess of the conjugate acid (red solution). When the solution pH is close to the indicator pKa, appreciable amounts of both conjugate partners are present, and the solution color is that of an additive combination of each (yellow and red, yielding orange). The color change interval (or pH interval) for an acid-base indicator is defined as the range of pH values over which a change in color is observed, and for most indicators this range is approximately pKa ± 1.
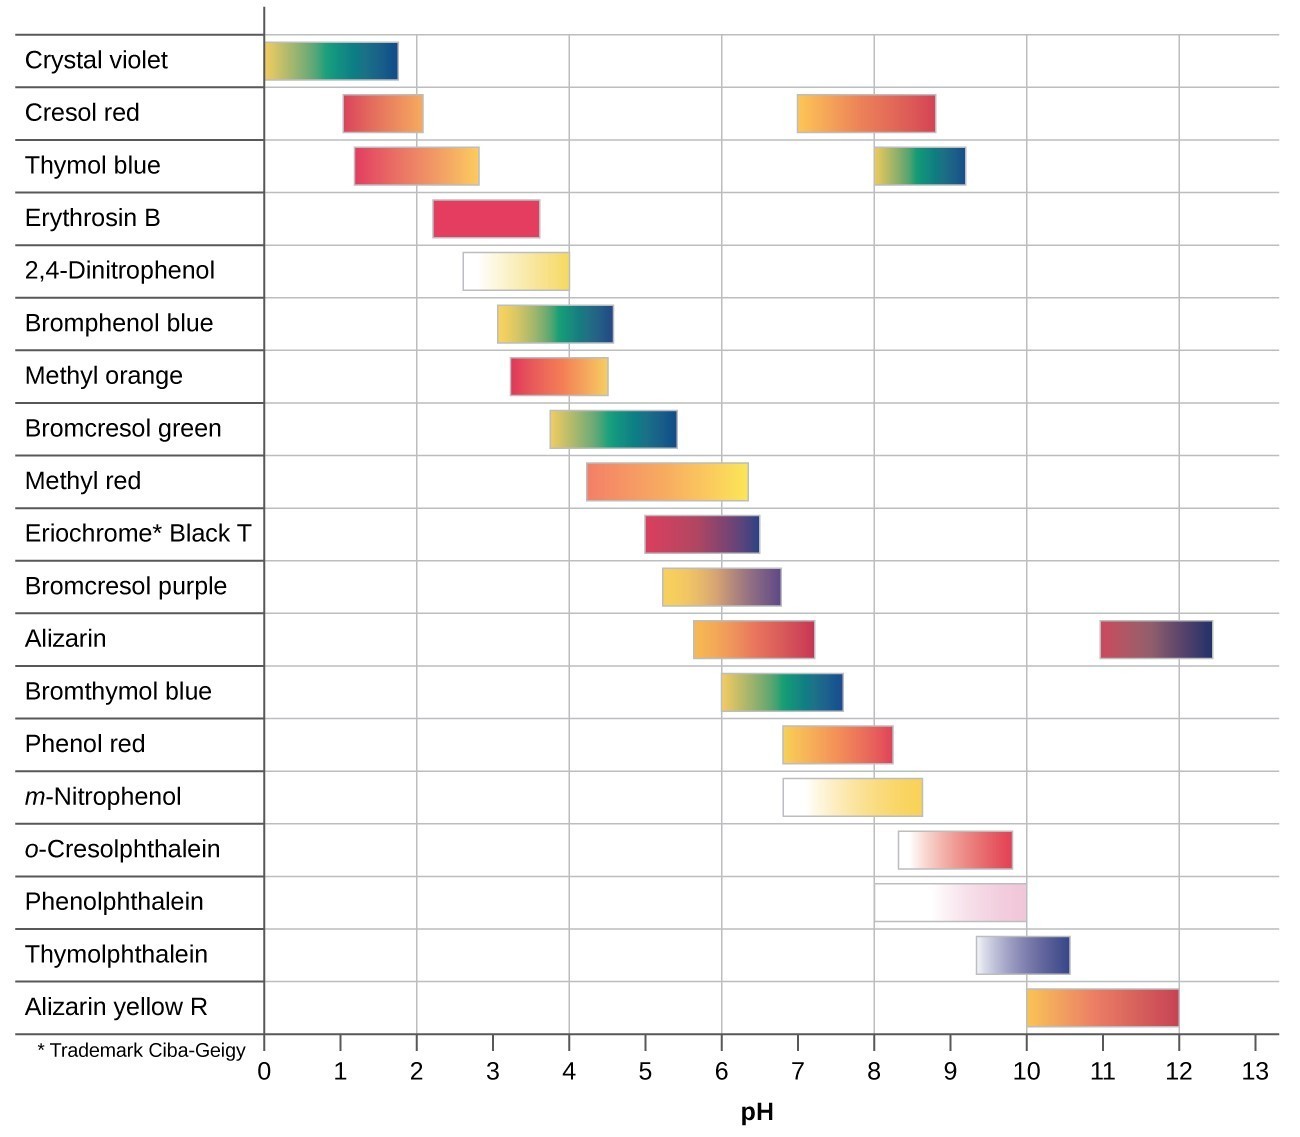
There are many different acid-base indicators that cover a wide range of pH values and can be used to determine the approximate pH of an unknown solution by a process of elimination. Universal indicators and pH paper contain a mixture of indicators and exhibit different colors at different pHs. Figure 15.7.2 presents several indicators, their colors, and their color-change intervals.
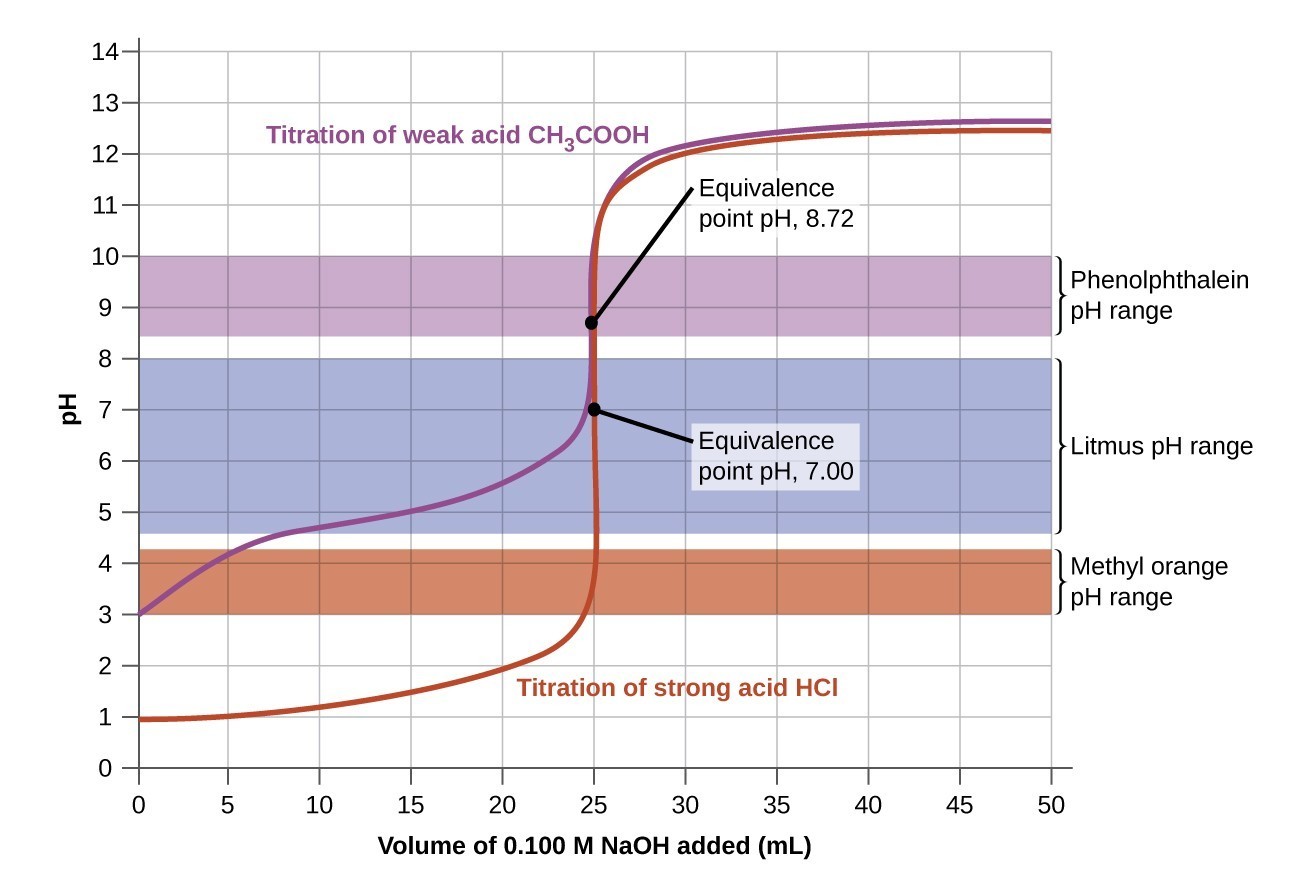
The titration curves shown in Figure 15.7.3 illustrate the choice of a suitable indicator for specific titrations. In the strong acid titration, use of any of the three indicators should yield reasonably sharp color changes and accurate end point determinations. For this titration, the solution pH reaches the lower limit of the methyl orange color change interval after addition of ~24 mL of titrant, at which point the initially red solution would begin to appear orange. When 25 mL of titrant has been added (the equivalence point), the pH is well above the upper limit and the solution will appear yellow. The titration’s end point may then be estimated as the volume of titrant that yields a distinct orange-to-yellow color change. This color change would be challenging for most human eyes to precisely discern. More-accurate estimates of the titration end point are possible using either litmus or phenolphthalein, both of which exhibit color change intervals that are encompassed by the steep rise in pH that occurs around the 25.00 mL equivalence point.
The weak acid titration curve in Figure 15.7.3 shows that only one of the three indicators is suitable for end point detection. If methyl orange is used in this titration, the solution will undergo a gradual red-to-orange-to-yellow color change over a relatively large volume interval (0–6 mL), completing the color change well before the equivalence point (25 mL) has been reached. Use of litmus would show a color change that begins after adding 7–8 mL of titrant and ends just before the equivalence point. Phenolphthalein, on the other hand, exhibits a color change interval that nicely brackets the abrupt change in pH occurring at the titration’s equivalence point. A sharp color change from colorless to pink will be observed within a very small volume interval around the equivalence point.
Key Concepts and Summary
The titration curve for an acid-base titration is typically a plot of pH versus volume of added titrant. These curves are useful in selecting appropriate acid-base indicators that will permit accurate determinations of titration end points.
Try It
- Explain how to choose the appropriate acid-base indicator for the titration of a weak base with a strong acid.
- Why can we ignore the contribution of water to the concentrations of [latex]{\text{H}}_{3}{\text{O}}^{\text{+}}[/latex] in the solutions of following acids: (1) 0.0092 M HClO, a weak acid, (2) 0.0810 M HCN, a weak acid, and (3) 0.120 M [latex]\text{Fe}{\left({\text{H}}_{2}\text{O}\right)}_{6}{}^{2+}[/latex] a weak acid, Ka = 1.6 [latex]\times[/latex] 10−7, but not the contribution of water to the concentration of OH−?
Show Solutions
- At the equivalence point in the titration of a weak base with a strong acid, the resulting solution is slightly acidic due to the presence of the conjugate acid. Thus, pick an indicator that changes color in the acidic range and brackets the pH at the equivalence point. Methyl orange is a good example.
- In an acid solution, the only source of OH− ions is water. We use Kw to calculate the concentration. If the contribution from water was neglected, the concentration of OH− would be zero.
Glossary
acid-base indicator: organic acid or base whose color changes depending on the pH of the solution it is in
color-change interval: range in pH over which the color change of an indicator takes place
titration curve: plot of the pH of a solution of acid or base versus the volume of base or acid added during a titration
Licenses and Attributions (Click to expand)
CC licensed content, Shared previously
- Chemistry 2e. Provided by: OpenStax. Located at: https://openstax.org/. License: CC BY: Attribution. License Terms: Access for free at
https://openstax.org/books/chemistry-2e/pages/1-introduction
plot of the pH of a solution of acid or base versus the volume of base or acid added during a titration
organic acid or base whose color changes depending on the pH of the solution it is in
range in pH over which the color change of an indicator takes place
