
Chapter 3. The First Law of Thermodynamics
3.2 Work, Heat, and Internal Energy
Learning Objectives
By the end of this section, you will be able to:
- Describe the work done by a system, heat transfer between objects, and internal energy change of a system
- Calculate the work, heat transfer, and internal energy change in a simple process
We discussed the concepts of work and energy earlier in mechanics. Examples and related issues of heat transfer between different objects have also been discussed in the preceding chapters. Here, we want to expand these concepts to a thermodynamic system and its environment. Specifically, we elaborated on the concepts of heat and heat transfer in the previous two chapters. Here, we want to understand how work is done by or to a thermodynamic system; how heat is transferred between a system and its environment; and how the total energy of the system changes under the influence of the work done and heat transfer.
Work Done by a System
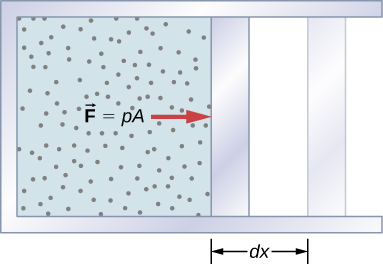
A force created from any source can do work by moving an object through a displacement. Then how does a thermodynamic system do work? Figure 3.4 shows a gas confined to a cylinder that has a movable piston at one end. If the gas expands against the piston, it exerts a force through a distance and does work on the piston. If the piston compresses the gas as it is moved inward, work is also done—in this case, on the gas. The work associated with such volume changes can be determined as follows: Let the gas pressure on the piston face be p. Then the force on the piston due to the gas is pA, where A is the area of the face. When the piston is pushed outward an infinitesimal distance dx, the magnitude of the work done by the gas is
Since the change in volume of the gas is [latex]dV=A\phantom{\rule{0.2em}{0ex}}dx,[/latex] this becomes
For a finite change in volume from [latex]{V}_{1}\phantom{\rule{0.2em}{0ex}}\text{to}\phantom{\rule{0.2em}{0ex}}{V}_{2},[/latex] we can integrate this equation from [latex]{V}_{1}\phantom{\rule{0.2em}{0ex}}\text{to}\phantom{\rule{0.2em}{0ex}}{V}_{2}[/latex] to find the net work:
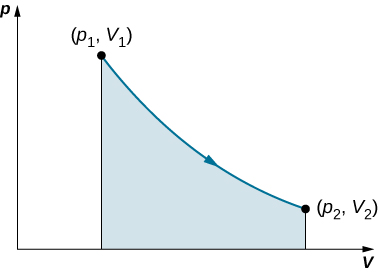
This integral is only meaningful for a quasi-static process, which means a process that takes place in infinitesimally small steps, keeping the system at thermal equilibrium. (We examine this idea in more detail later in this chapter.) Only then does a well-defined mathematical relationship (the equation of state) exist between the pressure and volume. This relationship can be plotted on a pV diagram of pressure versus volume, where the curve is the change of state. We can approximate such a process as one that occurs slowly, through a series of equilibrium states. The integral is interpreted graphically as the area under the pV curve (the shaded area of Figure 3.5). Work done by the gas is positive for expansion and negative for compression.
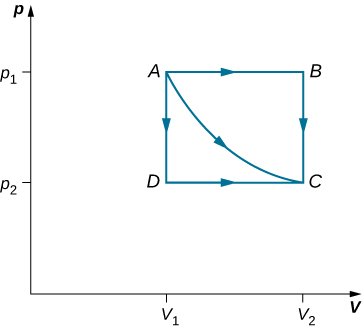
Consider the two processes involving an ideal gas that are represented by paths AC and ABC in Figure 3.6. The first process is an isothermal expansion, with the volume of the gas changing its volume from [latex]{V}_{1}\phantom{\rule{0.2em}{0ex}}\text{to}\phantom{\rule{0.2em}{0ex}}{V}_{2}[/latex]. This isothermal process is represented by the curve between points A and C. The gas is kept at a constant temperature T by keeping it in thermal equilibrium with a heat reservoir at that temperature. From Equation 3.4 and the ideal gas law,
The expansion is isothermal, so T remains constant over the entire process. Since n and R are also constant, the only variable in the integrand is V, so the work done by an ideal gas in an isothermal process is
Notice that if [latex]{V}_{2}>{V}_{1}[/latex] (expansion), W is positive, as expected.
The straight lines from A to B and then from B to C represent a different process. Here, a gas at a pressure [latex]{p}_{1}[/latex] first expands isobarically (constant pressure) and quasi-statically from [latex]{V}_{1}\phantom{\rule{0.2em}{0ex}}\text{to}\phantom{\rule{0.2em}{0ex}}{V}_{2}[/latex], after which it cools quasi-statically at the constant volume [latex]{V}_{2}[/latex] until its pressure drops to [latex]{p}_{2}[/latex]. From A to B, the pressure is constant at p, so the work over this part of the path is
From B to C, there is no change in volume and therefore no work is done. The net work over the path ABC is then
A comparison of the expressions for the work done by the gas in the two processes of Figure 3.6 shows that they are quite different. This illustrates a very important property of thermodynamic work: It is path dependent. We cannot determine the work done by a system as it goes from one equilibrium state to another unless we know its thermodynamic path. Different values of the work are associated with different paths.
Example
Isothermal Expansion of a van der Waals Gas
Studies of a van der Waals gas require an adjustment to the ideal gas law that takes into consideration that gas molecules have a definite volume (see The Kinetic Theory of Gases). One mole of a van der Waals gas has an equation of state
where a and b are two parameters for a specific gas. Suppose the gas expands isothermally and quasi-statically from volume [latex]{V}_{1}[/latex] to volume [latex]{V}_{2}.[/latex] How much work is done by the gas during the expansion?
Strategy
Because the equation of state is given, we can use Equation 3.4 to express the pressure in terms of V and T. Furthermore, temperature T is a constant under the isothermal condition, so V becomes the only changing variable under the integral.
Solution
Show Answer
To evaluate this integral, we must express p as a function of V. From the given equation of state, the gas pressure is
Because T is constant under the isothermal condition, the work done by 1 mol of a van der Waals gas in expanding from a volume [latex]{V}_{1}[/latex] to a volume [latex]{V}_{2}[/latex] is thus
Significance
By taking into account the volume of molecules, the expression for work is much more complex. If, however, we set [latex]a=0[/latex] and [latex]b=0,[/latex] we see that the expression for work matches exactly the work done by an isothermal process for one mole of an ideal gas.
Check Your Understanding
How much work is done by the gas, as given in Figure 3.6, when it expands quasi-statically along the path ADC?
Show Solution
[latex]{p}_{2}\left({V}_{2}-{V}_{1}\right)[/latex]
Internal Energy
The internal energy [latex]{E}_{\text{int}}[/latex] of a thermodynamic system is, by definition, the sum of the mechanical energies of all the molecules or entities in the system. If the kinetic and potential energies of molecule i are [latex]{K}_{i}[/latex] and [latex]{U}_{i},[/latex] respectively, then the internal energy of the system is the average of the total mechanical energy of all the entities:
where the summation is over all the molecules of the system, and the bars over K and U indicate average values. The kinetic energy [latex]{K}_{i}[/latex] of an individual molecule includes contributions due to its rotation and vibration, as well as its translational energy [latex]{m}_{i}{v}_{i}^{2}\text{/}2,[/latex] where [latex]{v}_{i}[/latex] is the molecule’s speed measured relative to the center of mass of the system. The potential energy [latex]{U}_{i}[/latex] is associated only with the interactions between molecule i and the other molecules of the system. In fact, neither the system’s location nor its motion is of any consequence as far as the internal energy is concerned. The internal energy of the system is not affected by moving it from the basement to the roof of a 100-story building or by placing it on a moving train.
In an ideal monatomic gas, each molecule is a single atom. Consequently, there is no rotational or vibrational kinetic energy and [latex]{K}_{i}={m}_{i}{v}_{i}^{2}\text{/}2[/latex]. Furthermore, there are no interatomic interactions (collisions notwithstanding), so [latex]{U}_{i}=\text{constant}[/latex], which we set to zero. The internal energy is therefore due to translational kinetic energy only and
From the discussion in the preceding chapter, we know that the average kinetic energy of a molecule in an ideal monatomic gas is
where T is the Kelvin temperature of the gas. Consequently, the average mechanical energy per molecule of an ideal monatomic gas is also [latex]3{k}_{\text{B}}T\text{/}2,[/latex] that is,
The internal energy is just the number of molecules multiplied by the average mechanical energy per molecule. Thus for n moles of an ideal monatomic gas,
Notice that the internal energy of a given quantity of an ideal monatomic gas depends on just the temperature and is completely independent of the pressure and volume of the gas. For other systems, the internal energy cannot be expressed so simply. However, an increase in internal energy can often be associated with an increase in temperature.
We know from the zeroth law of thermodynamics that when two systems are placed in thermal contact, they eventually reach thermal equilibrium, at which point they are at the same temperature. As an example, suppose we mix two monatomic ideal gases. Now, the energy per molecule of an ideal monatomic gas is proportional to its temperature. Thus, when the two gases are mixed, the molecules of the hotter gas must lose energy and the molecules of the colder gas must gain energy. This continues until thermal equilibrium is reached, at which point, the temperature, and therefore the average translational kinetic energy per molecule, is the same for both gases. The approach to equilibrium for real systems is somewhat more complicated than for an ideal monatomic gas. Nevertheless, we can still say that energy is exchanged between the systems until their temperatures are the same.
Summary
- Positive (negative) work is done by a thermodynamic system when it expands (contracts) under an external pressure.
- Heat is the energy transferred between two objects (or two parts of a system) because of a temperature difference.
- Internal energy of a thermodynamic system is its total mechanical energy.
Conceptual Questions
Is it possible to determine whether a change in internal energy is caused by heat transferred, by work performed, or by a combination of the two?
When a liquid is vaporized, its change in internal energy is not equal to the heat added. Why?
Show Solution
Some of the energy goes into changing the phase of the liquid to gas.
Why does a bicycle pump feel warm as you inflate your tire?
Is it possible for the temperature of a system to remain constant when heat flows into or out of it? If so, give examples.
Show Solution
Yes, as long as the work done equals the heat added there will be no change in internal energy and thereby no change in temperature. When water freezes or when ice melts while removing or adding heat, respectively, the temperature remains constant.
Problems
A gas at a pressure of 2.00 atm undergoes a quasi-static isobaric expansion from 3.00 to 5.00 L. How much work is done by the gas?
It takes 500 J of work to compress quasi-statically 0.50 mol of an ideal gas to one-fifth its original volume. Calculate the temperature of the gas, assuming it remains constant during the compression.
Show Solution
74 K
It is found that, when a dilute gas expands quasi-statically from 0.50 to 4.0 L, it does 250 J of work. Assuming that the gas temperature remains constant at 300 K, how many moles of gas are present?
In a quasi-static isobaric expansion, 500 J of work are done by the gas. If the gas pressure is 0.80 atm, what is the fractional increase in the volume of the gas, assuming it was originally at 20.0 L?
Show Solution
1.4 times
When a gas undergoes a quasi-static isobaric change in volume from 10.0 to 2.0 L, 15 J of work from an external source are required. What is the pressure of the gas?
An ideal gas expands quasi-statically and isothermally from a state with pressure p and volume V to a state with volume 4V. Show that the work done by the gas in the expansion is pV(ln 4).
Show Solution
pVln(4)
As shown below, calculate the work done by the gas in the quasi-static processes represented by the paths (a) AB; (b) ADB; (c) ACB; and (d) ADCB.
(a) Calculate the work done by the gas along the closed path shown below. The curved section between R and S is semicircular. (b) If the process is carried out in the opposite direction, what is the work done by the gas?
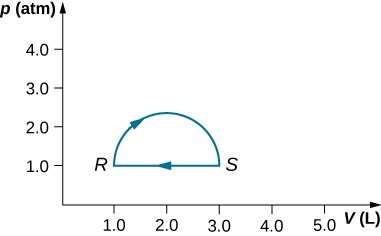
Show Solution
a. 160 J; b. –160 J
An ideal gas expands quasi-statically to three times its original volume. Which process requires more work from the gas, an isothermal process or an isobaric one? Determine the ratio of the work done in these processes.
A dilute gas at a pressure of 2.0 atm and a volume of 4.0 L is taken through the following quasi-static steps: (a) an isobaric expansion to a volume of 10.0 L, (b) an isochoric change to a pressure of 0.50 atm, (c) an isobaric compression to a volume of 4.0 L, and (d) an isochoric change to a pressure of 2.0 atm. Show these steps on a pV diagram and determine from your graph the net work done by the gas.
Show Solution
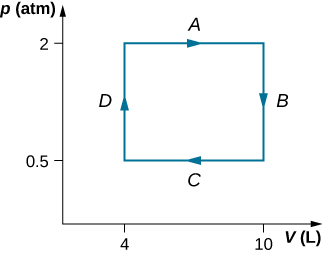
[latex]W=900\phantom{\rule{0.2em}{0ex}}\text{J}[/latex]
What is the average mechanical energy of the atoms of an ideal monatomic gas at 300 K?
What is the internal energy of 6.00 mol of an ideal monatomic gas at [latex]200\phantom{\rule{0.2em}{0ex}}\text{°}\text{C}[/latex] ?
Show Solution
[latex]3.53\phantom{\rule{0.2em}{0ex}}×\phantom{\rule{0.2em}{0ex}}{10}^{4}\phantom{\rule{0.2em}{0ex}}\text{J}[/latex]
Calculate the internal energy of 15 mg of helium at a temperature of [latex]0\phantom{\rule{0.2em}{0ex}}\text{°}\text{C}.[/latex]
Two monatomic ideal gases A and B are at the same temperature. If 1.0 g of gas A has the same internal energy as 0.10 g of gas B, what are (a) the ratio of the number of moles of each gas and (b) the ration of the atomic masses of the two gases?
Show Solution
a. 1:1; b. 10:1
The van der Waals coefficients for oxygen are [latex]a=0.138\phantom{\rule{0.2em}{0ex}}\text{J}·{\text{m}}^{3}\text{/}{\text{mol}}^{2}[/latex] and [latex]b=3.18\phantom{\rule{0.2em}{0ex}}×\phantom{\rule{0.2em}{0ex}}{10}^{-5}{\phantom{\rule{0.2em}{0ex}}\text{m}}^{3}\text{/}\text{mol}[/latex]. Use these values to draw a van der Waals isotherm of oxygen at 100 K. On the same graph, draw isotherms of one mole of an ideal gas.
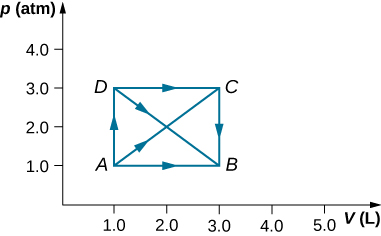
Find the work done in the quasi-static processes shown below. The states are given as (p, V) values for the points in the pV plane: 1 (3 atm, 4 L), 2 (3 atm, 6 L), 3 (5 atm, 4 L), 4 (2 atm, 6 L), 5 (4 atm, 2 L), 6 (5 atm, 5 L), and 7 (2 atm, 5 L).
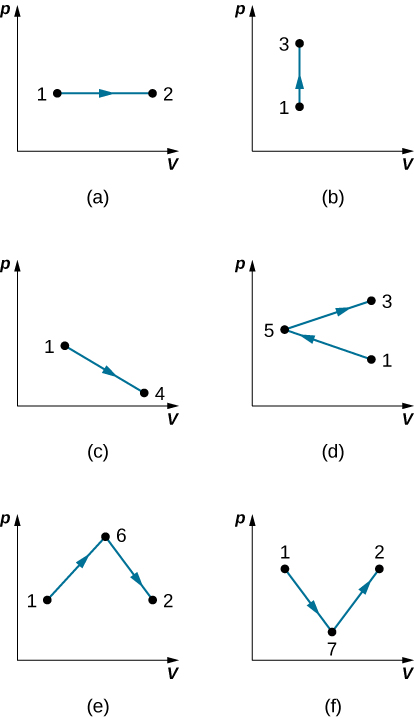
Show Solution
a. 600 J; b. 0; c. 500 J; d. 200 J; e. 800 J; f. 500 J
Glossary
- internal energy
- average of the total mechanical energy of all the molecules or entities in the system
- quasi-static process
- evolution of a system that goes so slowly that the system involved is always in thermodynamic equilibrium
Licenses and Attributions
Work, Heat, and Internal Energy. Authored by: OpenStax College. Located at: https://openstax.org/books/university-physics-volume-2/pages/3-2-work-heat-and-internal-energy. License: CC BY: Attribution. License Terms: Download for free at https://openstax.org/books/university-physics-volume-2/pages/1-introduction
