
Psychological Research
Statistical Significance
Learning Objectives
- Describe the importance of distributional thinking and the role of p-values in statistical inference
Introduction to Statistical Thinking

Does drinking coffee actually increase your life expectancy? A recent study (Freedman, Park, Abnet, Hollenbeck, & Sinha, 2012) found that men who drank at least six cups of coffee a day also had a 10% lower chance of dying (women’s chances were 15% lower) than those who drank none. Does this mean you should pick up or increase your own coffee habit? We will explore these results in more depth in the next section about drawing conclusions from statistics. Modern society has become awash in studies such as this; you can read about several such studies in the news every day.
Conducting such a study well, and interpreting the results of such studies requires understanding basic ideas of statistics, the science of gaining insight from data. Key components to a statistical investigation are:
- Planning the study: Start by asking a testable research question and deciding how to collect data. For example, how long was the study period of the coffee study? How many people were recruited for the study, how were they recruited, and from where? How old were they? What other variables were recorded about the individuals? Were changes made to the participants’ coffee habits during the course of the study?
- Examining the data: What are appropriate ways to examine the data? What graphs are relevant, and what do they reveal? What descriptive statistics can be calculated to summarize relevant aspects of the data, and what do they reveal? What patterns do you see in the data? Are there any individual observations that deviate from the overall pattern, and what do they reveal? For example, in the coffee study, did the proportions differ when we compared the smokers to the non-smokers?
- Inferring from the data: What are valid statistical methods for drawing inferences “beyond” the data you collected? In the coffee study, is the 10%–15% reduction in risk of death something that could have happened just by chance?
- Drawing conclusions: Based on what you learned from your data, what conclusions can you draw? Who do you think these conclusions apply to? (Were the people in the coffee study older? Healthy? Living in cities?) Can you draw a cause-and-effect conclusion about your treatments? (Are scientists now saying that the coffee drinking is the cause of the decreased risk of death?)
Notice that the numerical analysis (“crunching numbers” on the computer) comprises only a small part of overall statistical investigation. In this section, you will see how we can answer some of these questions and what questions you should be asking about any statistical investigation you read about.
Distributional Thinking
When data are collected to address a particular question, an important first step is to think of meaningful ways to organize and examine the data. Let’s take a look at an example.
Example 1: Researchers investigated whether cancer pamphlets are written at an appropriate level to be read and understood by cancer patients (Short, Moriarty, & Cooley, 1995). Tests of reading ability were given to 63 patients. In addition, readability level was determined for a sample of 30 pamphlets, based on characteristics such as the lengths of words and sentences in the pamphlet. The results, reported in terms of grade levels, are displayed in Figure 2.
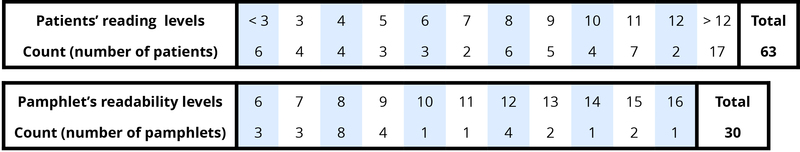
- Data vary. More specifically, values of a variable (such as reading level of a cancer patient or readability level of a cancer pamphlet) vary.
- Analyzing the pattern of variation, called the distribution of the variable, often reveals insights.
Addressing the research question of whether the cancer pamphlets are written at appropriate levels for the cancer patients requires comparing the two distributions. A naïve comparison might focus only on the centers of the distributions. Both medians turn out to be ninth grade, but considering only medians ignores the variability and the overall distributions of these data. A more illuminating approach is to compare the entire distributions, for example with a graph, as in Figure 3.
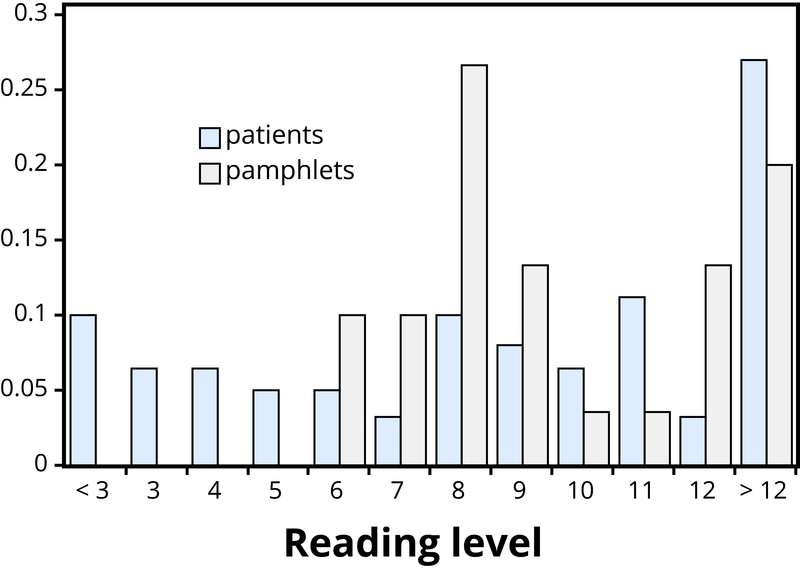
Figure 2 makes clear that the two distributions are not well aligned at all. The most glaring discrepancy is that many patients (17/63, or 27%, to be precise) have a reading level below that of the most readable pamphlet. These patients will need help to understand the information provided in the cancer pamphlets. Notice that this conclusion follows from considering the distributions as a whole, not simply measures of center or variability, and that the graph contrasts those distributions more immediately than the frequency tables.
Try It
Finding Significance in Data
Even when we find patterns in data, often there is still uncertainty in various aspects of the data. For example, there may be potential for measurement errors (even your own body temperature can fluctuate by almost 1°F over the course of the day). Or we may only have a “snapshot” of observations from a more long-term process or only a small subset of individuals from the population of interest. In such cases, how can we determine whether patterns we see in our small set of data is convincing evidence of a systematic phenomenon in the larger process or population? Let’s take a look at another example.
Example 2: In a study reported in the November 2007 issue of Nature, researchers investigated whether pre-verbal infants take into account an individual’s actions toward others in evaluating that individual as appealing or aversive (Hamlin, Wynn, & Bloom, 2007). In one component of the study, 10-month-old infants were shown a “climber” character (a piece of wood with “googly” eyes glued onto it) that could not make it up a hill in two tries. Then the infants were shown two scenarios for the climber’s next try, one where the climber was pushed to the top of the hill by another character (“helper”), and one where the climber was pushed back down the hill by another character (“hinderer”). The infant was alternately shown these two scenarios several times. Then the infant was presented with two pieces of wood (representing the helper and the hinderer characters) and asked to pick one to play with.
The researchers found that of the 16 infants who made a clear choice, 14 chose to play with the helper toy. One possible explanation for this clear majority result is that the helping behavior of the one toy increases the infants’ likelihood of choosing that toy. But are there other possible explanations? What about the color of the toy? Well, prior to collecting the data, the researchers arranged so that each color and shape (red square and blue circle) would be seen by the same number of infants. Or maybe the infants had right-handed tendencies and so picked whichever toy was closer to their right hand?
Well, prior to collecting the data, the researchers arranged it so half the infants saw the helper toy on the right and half on the left. Or, maybe the shapes of these wooden characters (square, triangle, circle) had an effect? Perhaps, but again, the researchers controlled for this by rotating which shape was the helper toy, the hinderer toy, and the climber. When designing experiments, it is important to control for as many variables as might affect the responses as possible. It is beginning to appear that the researchers accounted for all the other plausible explanations. But there is one more important consideration that cannot be controlled—if we did the study again with these 16 infants, they might not make the same choices. In other words, there is some randomness inherent in their selection process.
P-value
Maybe each infant had no genuine preference at all, and it was simply “random luck” that led to 14 infants picking the helper toy. Although this random component cannot be controlled, we can apply a probability model to investigate the pattern of results that would occur in the long run if random chance were the only factor.
If the infants were equally likely to pick between the two toys, then each infant had a 50% chance of picking the helper toy. It’s like each infant tossed a coin, and if it landed heads, the infant picked the helper toy. So if we tossed a coin 16 times, could it land heads 14 times? Sure, it’s possible, but it turns out to be very unlikely. Getting 14 (or more) heads in 16 tosses is about as likely as tossing a coin and getting 9 heads in a row. This probability is referred to as a p-value. The p-value represents the likelihood that experimental results happened by chance. Within psychology, the most common standard for p-values is “p < .05”. What this means is that there is less than a 5% probability that the results happened just by random chance, and therefore a 95% probability that the results reflect a meaningful pattern in human psychology. We call this statistical significance.
So, in the study above, if we assume that each infant was choosing equally, then the probability that 14 or more out of 16 infants would choose the helper toy is found to be 0.0021. We have only two logical possibilities: either the infants have a genuine preference for the helper toy, or the infants have no preference (50/50) and an outcome that would occur only 2 times in 1,000 iterations happened in this study. Because this p-value of 0.0021 is quite small, we conclude that the study provides very strong evidence that these infants have a genuine preference for the helper toy.
If we compare the p-value to some cut-off value, like 0.05, we see that the p=value is smaller. Because the p-value is smaller than that cut-off value, then we reject the hypothesis that only random chance was at play here. In this case, these researchers would conclude that significantly more than half of the infants in the study chose the helper toy, giving strong evidence of a genuine preference for the toy with the helping behavior.
Try It
Licenses and Attributions (Click to expand)
CC licensed content, Shared previously
- Statistical Thinking. Authored by: Beth Chance and Allan Rossman . Provided by: California Polytechnic State University, San Luis Obispo. Located at: http://nobaproject.com/modules/statistical-thinking. Project: The Noba Project. License: CC BY-NC-SA: Attribution-NonCommercial-ShareAlike. License Terms: http://nobaproject.com/license-agreement
a numerical result computed from a sample (e.g., mean, proportion)
the collection of individuals on which we collect data.
the pattern of variation in data
a larger collection of individuals that we would like to generalize our results to.
the probability of observing a particular outcome in a sample, or more extreme, under a conjecture about the larger population or process.
a result is statistically significant if it is unlikely to arise by chance alone
