
Psychological Research
Correlational Research
Learning Objectives
- Explain what a correlation coefficient tells us about the relationship between variables
- Describe why correlation does not mean causation
Did you know that as sales in ice cream increase, so does the overall rate of crime? Is it possible that indulging in your favorite flavor of ice cream could send you on a crime spree? Or, after committing crime do you think you might decide to treat yourself to a cone? There is no question that a relationship exists between ice cream and crime (e.g., Harper, 2013), but it would be pretty foolish to decide that one thing actually caused the other to occur.
It is much more likely that both ice cream sales and crime rates are related to the temperature outside. When the temperature is warm, there are lots of people out of their houses, interacting with each other, getting annoyed with one another, and sometimes committing crimes. Also, when it is warm outside, we are more likely to seek a cool treat like ice cream. How do we determine if there is indeed a relationship between two things? And when there is a relationship, how can we discern whether it is attributable to coincidence or causation?
Correlational Research
Correlation means that there is a relationship between two or more variables (such as ice cream consumption and crime), but this relationship does not necessarily imply cause and effect. When two variables are correlated, it simply means that as one variable changes, so does the other. We can measure correlation by calculating a statistic known as a correlation coefficient. A correlation coefficient is a number from -1 to +1 that indicates the strength and direction of the relationship between variables. The correlation coefficient is usually represented by the letter r.
The number portion of the correlation coefficient indicates the strength of the relationship. The closer the number is to 1 (be it negative or positive), the more strongly related the variables are, and the more predictable changes in one variable will be as the other variable changes. The closer the number is to zero, the weaker the relationship, and the less predictable the relationships between the variables becomes. For instance, a correlation coefficient of 0.9 indicates a far stronger relationship than a correlation coefficient of 0.3. If the variables are not related to one another at all, the correlation coefficient is 0. The example above about ice cream and crime is an example of two variables that we might expect to have no relationship to each other.
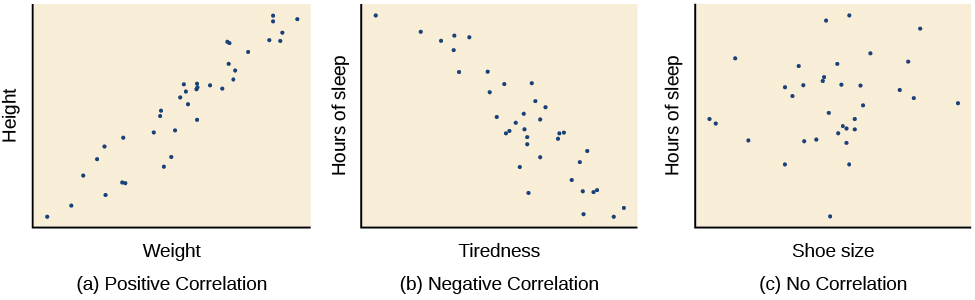
The sign—positive or negative—of the correlation coefficient indicates the direction of the relationship (Figure 1). A positive correlation means that the variables move in the same direction. Put another way, it means that as one variable increases so does the other, and conversely, when one variable decreases so does the other. A negative correlation means that the variables move in opposite directions. If two variables are negatively correlated, a decrease in one variable is associated with an increase in the other and vice versa.
The example of ice cream and crime rates is a positive correlation because both variables increase when temperatures are warmer. Other examples of positive correlations are the relationship between an individual’s height and weight or the relationship between a person’s age and number of wrinkles. One might expect a negative correlation to exist between someone’s tiredness during the day and the number of hours they slept the previous night: the amount of sleep decreases as the feelings of tiredness increase. In a real-world example of negative correlation, student researchers at the University of Minnesota found a weak negative correlation (r = -0.29) between the average number of days per week that students got fewer than 5 hours of sleep and their GPA (Lowry, Dean, & Manders, 2010). Keep in mind that a negative correlation is not the same as no correlation. For example, we would probably find no correlation between hours of sleep and shoe size.
As mentioned earlier, correlations have predictive value. Imagine that you are on the admissions committee of a major university. You are faced with a huge number of applications, but you are able to accommodate only a small percentage of the applicant pool. How might you decide who should be admitted? You might try to correlate your current students’ college GPA with their scores on standardized tests like the SAT or ACT. By observing which correlations were strongest for your current students, you could use this information to predict relative success of those students who have applied for admission into the university.
Correlation Does Not Indicate Causation
Correlational research is useful because it allows us to discover the strength and direction of relationships that exist between two variables. However, correlation is limited because establishing the existence of a relationship tells us little about cause and effect. While variables are sometimes correlated because one does cause the other, it could also be that some other factor, a confounding variable, is actually causing the systematic movement in our variables of interest. In the ice cream/crime rate example mentioned earlier, temperature is a confounding variable that could account for the relationship between the two variables.
Even when we cannot point to clear confounding variables, we should not assume that a correlation between two variables implies that one variable causes changes in another. This can be frustrating when a cause-and-effect relationship seems clear and intuitive. Think back to our discussion of the research done by the American Cancer Society and how their research projects were some of the first demonstrations of the link between smoking and cancer. It seems reasonable to assume that smoking causes cancer, but if we were limited to correlational research, we would be overstepping our bounds by making this assumption.
Unfortunately, people mistakenly make claims of causation as a function of correlations all the time. Such claims are especially common in advertisements and news stories. For example, recent research found that people who eat cereal on a regular basis achieve healthier weights than those who rarely eat cereal (Frantzen, Treviño, Echon, Garcia-Dominic, & DiMarco, 2013; Barton et al., 2005). Guess how the cereal companies report this finding. Does eating cereal really cause an individual to maintain a healthy weight, or are there other possible explanations, such as, someone at a healthy weight is more likely to regularly eat a healthy breakfast than someone who is obese or someone who avoids meals in an attempt to diet (Figure 2)? While correlational research is invaluable in identifying relationships among variables, a major limitation is the inability to establish causality. Psychologists want to make statements about cause and effect, but the only way to do that is to conduct an experiment to answer a research question. The next section describes how scientific experiments incorporate methods that eliminate, or control for, alternative explanations, which allow researchers to explore how changes in one variable cause changes in another variable.
Try It
Watch It
Watch this clip from Freakonomics for an example of how correlation does not indicate causation.
You can view the transcript for “Correlation vs. Causality: Freakonomics Movie” here (opens in new window).

Illusory Correlations
The temptation to make erroneous cause-and-effect statements based on correlational research is not the only way we tend to misinterpret data. We also tend to make the mistake of illusory correlations, especially with unsystematic observations. Illusory correlations, or false correlations, occur when people believe that relationships exist between two things when no such relationship exists. One well-known illusory correlation is the supposed effect that the moon’s phases have on human behavior. Many people passionately assert that human behavior is affected by the phase of the moon, and specifically, that people act strangely when the moon is full (Figure 3).

There is no denying that the moon exerts a powerful influence on our planet. The ebb and flow of the ocean’s tides are tightly tied to the gravitational forces of the moon. Many people believe, therefore, that it is logical that we are affected by the moon as well. After all, our bodies are largely made up of water. A meta-analysis of nearly 40 studies consistently demonstrated, however, that the relationship between the moon and our behavior does not exist (Rotton & Kelly, 1985). While we may pay more attention to odd behavior during the full phase of the moon, the rates of odd behavior remain constant throughout the lunar cycle.
Why are we so apt to believe in illusory correlations like this? Often we read or hear about them and simply accept the information as valid. Or, we have a hunch about how something works and then look for evidence to support that hunch, ignoring evidence that would tell us our hunch is false; this is known as confirmation bias. Other times, we find illusory correlations based on the information that comes most easily to mind, even if that information is severely limited. And while we may feel confident that we can use these relationships to better understand and predict the world around us, illusory correlations can have significant drawbacks. For example, research suggests that illusory correlations—in which certain behaviors are inaccurately attributed to certain groups—are involved in the formation of prejudicial attitudes that can ultimately lead to discriminatory behavior (Fiedler, 2004).
Think It Over
Licenses and Attributions (Click to expand)
CC licensed content, Shared previously
- Analyzing Findings. Authored by: OpenStax College. Located at: https://openstax.org/books/psychology-2e/pages/2-3-analyzing-findings. License: CC BY: Attribution. License Terms: Download for free at https://openstax.org/books/psychology-2e/pages/1-introduction.
All rights reserved content
- Correlation vs. Causality: Freakonomics Movie. Located at: https://www.youtube.com/watch?v=lbODqslc4Tg. License: Other. License Terms: Standard YouTube License
relationship between two or more variables; when two variables are correlated, one variable changes as the other does
number from -1 to +1, indicating the strength and direction of the relationship between variables, and usually represented by r
two variables change in the same direction, both becoming either larger or smaller
two variables change in different directions, with one becoming larger as the other becomes smaller; a negative correlation is not the same thing as no correlation
related to whether we say one variable is causing changes in the other variable, versus other variables that may be related to these two variables.
unanticipated outside factor that affects both variables of interest, often giving the false impression that changes in one variable causes changes in the other variable, when, in actuality, the outside factor causes changes in both variables
changes in one variable cause the changes in the other variable; can be determined only through an experimental research design
seeing relationships between two things when in reality no such relationship exists
seeking out information that supports our stereotypes while ignoring information that is inconsistent with our stereotypes
