
Photons and Matter Waves
Blackbody Radiation
Samuel J. Ling; Jeff Sanny; and William Moebs
Learning Objectives
By the end of this section you will be able to:
- Apply Wien’s and Stefan’s laws to analyze radiation emitted by a blackbody
- Explain Planck’s hypothesis of energy quanta
All bodies emit electromagnetic radiation over a range of wavelengths. In an earlier chapter, we learned that a cooler body radiates less energy than a warmer body. We also know by observation that when a body is heated and its temperature rises, the perceived wavelength of its emitted radiation changes from infrared to red, and then from red to orange, and so forth. As its temperature rises, the body glows with the colors corresponding to ever-smaller wavelengths of the electromagnetic spectrum. This is the underlying principle of the incandescent light bulb: A hot metal filament glows red, and when heating continues, its glow eventually covers the entire visible portion of the electromagnetic spectrum. The temperature (T) of the object that emits radiation, or the emitter, determines the wavelength at which the radiated energy is at its maximum. For example, the Sun, whose surface temperature is in the range between 5000 K and 6000 K, radiates most strongly in a range of wavelengths about 560 nm in the visible part of the electromagnetic spectrum. Your body, when at its normal temperature of about 300 K, radiates most strongly in the infrared part of the spectrum.
Radiation that is incident on an object is partially absorbed and partially reflected. At thermodynamic equilibrium, the rate at which an object absorbs radiation is the same as the rate at which it emits it. Therefore, a good absorber of radiation (any object that absorbs radiation) is also a good emitter. A perfect absorber absorbs all electromagnetic radiation incident on it; such an object is called a blackbody.
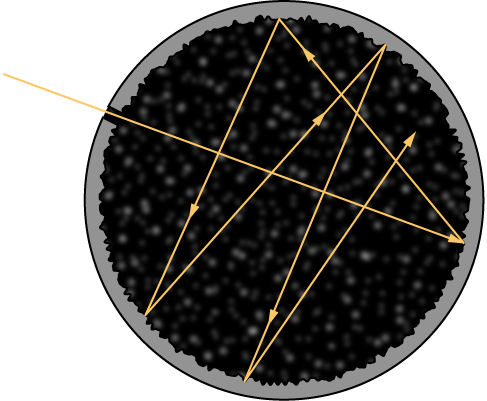
Although the blackbody is an idealization, because no physical object absorbs 100% of incident radiation, we can construct a close realization of a blackbody in the form of a small hole in the wall of a sealed enclosure known as a cavity radiator, as shown in (Figure). The inside walls of a cavity radiator are rough and blackened so that any radiation that enters through a tiny hole in the cavity wall becomes trapped inside the cavity. At thermodynamic equilibrium (at temperature T), the cavity walls absorb exactly as much radiation as they emit. Furthermore, inside the cavity, the radiation entering the hole is balanced by the radiation leaving it. The emission spectrum of a blackbody can be obtained by analyzing the light radiating from the hole. Electromagnetic waves emitted by a blackbody are called blackbody radiation.
The intensity  of blackbody radiation depends on the wavelength
  of the emitted radiation and on the temperature T of the blackbody ((Figure)). The function is the power intensity that is radiated per unit wavelength; in other words, it is the power radiated per unit area of the hole in a cavity radiator per unit wavelength. According to this definition,
  is the power per unit area that is emitted in the wavelength interval from to
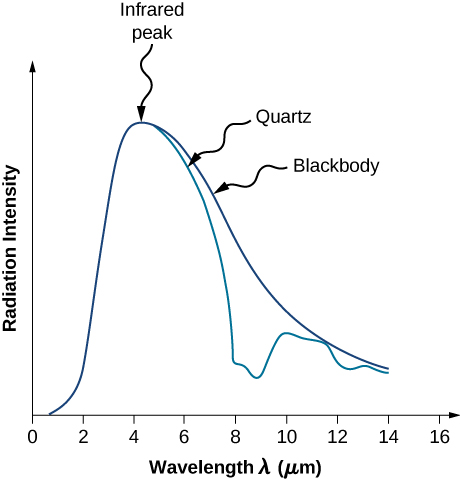
  The intensity distribution among wavelengths of radiation emitted by cavities was studied experimentally at the end of the nineteenth century. Generally, radiation emitted by materials only approximately follows the blackbody radiation curve ((Figure)); however, spectra of common stars do follow the blackbody radiation curve very closely.
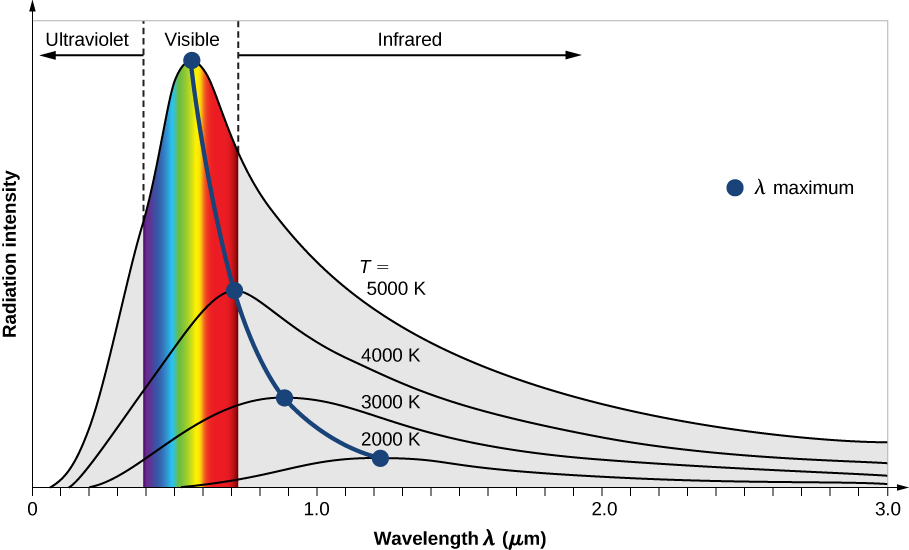
Two important laws summarize the experimental findings of blackbody radiation: Wien’s displacement law and Stefan’s law. Wien’s displacement law is illustrated in (Figure) by the curve connecting the maxima on the intensity curves. In these curves, we see that the hotter the body, the shorter the wavelength corresponding to the emission peak in the radiation curve. Quantitatively, Wien’s law reads

where  is the position of the maximum in the radiation curve. In other words, is the wavelength at which a blackbody radiates most strongly at a given temperature T. Note that in (Figure), the temperature is in kelvins. Wien’s displacement law allows us to estimate the temperatures of distant stars by measuring the wavelength of radiation they emit.
Example
Temperatures of Distant Stars
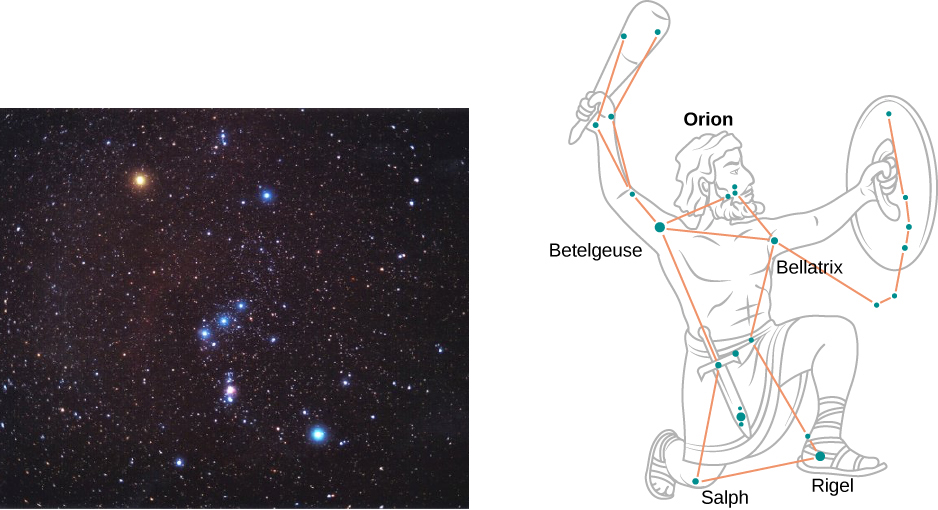
On a clear evening during the winter months, if you happen to be in the Northern Hemisphere and look up at the sky, you can see the constellation Orion (The Hunter). One star in this constellation, Rigel, flickers in a blue color and another star, Betelgeuse, has a reddish color, as shown in (Figure). Which of these two stars is cooler, Betelgeuse or Rigel?
Strategy We treat each star as a blackbody. Then according to Wien’s law, its temperature is inversely proportional to the wavelength of its peak intensity. The wavelength  of blue light is shorter than the wavelength
  of red light. Even if we do not know the precise wavelengths, we can still set up a proportion.
Solution
Writing Wien’s law for the blue star and for the red star, we have

When simplified, (Figure) gives

Therefore, Betelgeuse is cooler than Rigel.
Significance Note that Wien’s displacement law tells us that the higher the temperature of an emitting body, the shorter the wavelength of the radiation it emits. The qualitative analysis presented in this example is generally valid for any emitting body, whether it is a big object such as a star or a small object such as the glowing filament in an incandescent lightbulb.
Check Your Understanding The flame of a peach-scented candle has a yellowish color and the flame of a Bunsen’s burner in a chemistry lab has a bluish color. Which flame has a higher temperature?
Bunsen’s burner
The second experimental relation is Stefan’s law, which concerns the total power of blackbody radiation emitted across the entire spectrum of wavelengths at a given temperature. In (Figure), this total power is represented by the area under the blackbody radiation curve for a given T. As the temperature of a blackbody increases, the total emitted power also increases. Quantitatively, Stefan’s law expresses this relation as

where  is the surface area of a blackbody, T is its temperature (in kelvins), and
  is the Stefan–Boltzmann constant,
  Stefan’s law enables us to estimate how much energy a star is radiating by remotely measuring its temperature.
Example
Power Radiated by Stars
A star such as our Sun will eventually evolve to a “red giant” star and then to a “white dwarf” star. A typical white dwarf is approximately the size of Earth, and its surface temperature is about  A typical red giant has a surface temperature of
  and a radius ~100,000 times larger than that of a white dwarf. What is the average radiated power per unit area and the total power radiated by each of these types of stars? How do they compare?
Strategy
If we treat the star as a blackbody, then according to Stefan’s law, the total power that the star radiates is proportional to the fourth power of its temperature. To find the power radiated per unit area of the surface, we do not need to make any assumptions about the shape of the star because P/A depends only on temperature. However, to compute the total power, we need to make an assumption that the energy radiates through a spherical surface enclosing the star, so that the surface area is  where R is its radius.
Solution
A simple proportion based on Stefan’s law gives

The power emitted per unit area by a white dwarf is about 5000 times that the power emitted by a red giant. Denoting this ratio by  (Figure) gives

We see that the total power emitted by a white dwarf is a tiny fraction of the total power emitted by a red giant. Despite its relatively lower temperature, the overall power radiated by a red giant far exceeds that of the white dwarf because the red giant has a much larger surface area. To estimate the absolute value of the emitted power per unit area, we again use Stefan’s law. For the white dwarf, we obtain

The analogous result for the red giant is obtained by scaling the result for a white dwarf:

Significance
To estimate the total power emitted by a white dwarf, in principle, we could use (Figure). However, to find its surface area, we need to know the average radius, which is not given in this example. Therefore, the solution stops here. The same is also true for the red giant star.
Check Your Understanding An iron poker is being heated. As its temperature rises, the poker begins to glow—first dull red, then bright red, then orange, and then yellow. Use either the blackbody radiation curve or Wien’s law to explain these changes in the color of the glow.
XXXXX
The wavelength of the radiation maximum decreases with increasing temperature.
Check Your Understanding Suppose that two stars,  and
and  radiate exactly the same total power. If the radius of star is three times that of star what is the ratio of the surface temperatures of these stars? Which one is hotter?
 so the star
  is hotter.
The term “blackbody” was coined by Gustav R. Kirchhoff in 1862. The blackbody radiation curve was known experimentally, but its shape eluded physical explanation until the year 1900. The physical model of a blackbody at temperature T is that of the electromagnetic waves enclosed in a cavity (see (Figure)) and at thermodynamic equilibrium with the cavity walls. The waves can exchange energy with the walls. The objective here is to find the energy density distribution among various modes of vibration at various wavelengths (or frequencies). In other words, we want to know how much energy is carried by a single wavelength or a band of wavelengths. Once we know the energy distribution, we can use standard statistical methods (similar to those studied in a previous chapter) to obtain the blackbody radiation curve, Stefan’s law, and Wien’s displacement law. When the physical model is correct, the theoretical predictions should be the same as the experimental curves.
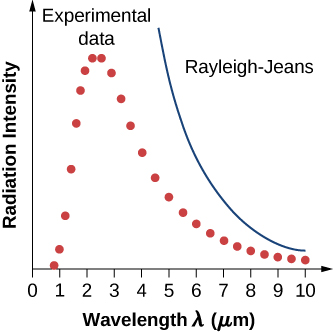
In a classical approach to the blackbody radiation problem, in which radiation is treated as waves (as you have studied in previous chapters), the modes of electromagnetic waves trapped in the cavity are in equilibrium and continually exchange their energies with the cavity walls. There is no physical reason why a wave should do otherwise: Any amount of energy can be exchanged, either by being transferred from the wave to the material in the wall or by being received by the wave from the material in the wall. This classical picture is the basis of the model developed by Lord Rayleigh and, independently, by Sir James Jeans. The result of this classical model for blackbody radiation curves is known as the Rayleigh–Jeans law. However, as shown in (Figure), the Rayleigh–Jeans law fails to correctly reproduce experimental results. In the limit of short wavelengths, the Rayleigh–Jeans law predicts infinite radiation intensity, which is inconsistent with the experimental results in which radiation intensity has finite values in the ultraviolet region of the spectrum. This divergence between the results of classical theory and experiments, which came to be called the ultraviolet catastrophe, shows how classical physics fails to explain the mechanism of blackbody radiation.
The blackbody radiation problem was solved in 1900 by Max Planck. Planck used the same idea as the Rayleigh–Jeans model in the sense that he treated the electromagnetic waves between the walls inside the cavity classically, and assumed that the radiation is in equilibrium with the cavity walls. The innovative idea that Planck introduced in his model is the assumption that the cavity radiation originates from atomic oscillations inside the cavity walls, and that these oscillations can have only discrete values of energy. Therefore, the radiation trapped inside the cavity walls can exchange energy with the walls only in discrete amounts. Planck’s hypothesis of discrete energy values, which he called quanta, assumes that the oscillators inside the cavity walls have quantized energies. This was a brand new idea that went beyond the classical physics of the nineteenth century because, as you learned in a previous chapter, in the classical picture, the energy of an oscillator can take on any continuous value. Planck assumed that the energy of an oscillator ( ) can have only discrete, or quantized, values:

In (Figure), f is the frequency of Planck’s oscillator. The natural number n that enumerates these discrete energies is called a quantum number. The physical constant h is called Planck’s constant:

Each discrete energy value corresponds to a quantum state of a Planck oscillator. Quantum states are enumerated by quantum numbers. For example, when Planck’s oscillator is in its first  quantum state, its energy is
  when it is in the
  quantum state, its energy is
  when it is in the
  quantum state,
  and so on.
Note that (Figure) shows that there are infinitely many quantum states, which can be represented as a sequence {hf, 2hf, 3hf,…, (n – 1)hf, nhf, (n + 1)hf,…}. Each two consecutive quantum states in this sequence are separated by an energy jump,  An oscillator in the wall can receive energy from the radiation in the cavity (absorption), or it can give away energy to the radiation in the cavity (emission). The absorption process sends the oscillator to a higher quantum state, and the emission process sends the oscillator to a lower quantum state. Whichever way this exchange of energy goes, the smallest amount of energy that can be exchanged is hf. There is no upper limit to how much energy can be exchanged, but whatever is exchanged must be an integer multiple of hf. If the energy packet does not have this exact amount, it is neither absorbed nor emitted at the wall of the blackbody.
Planck’s hypothesis of energy quanta states that the amount of energy emitted by the oscillator is carried by the quantum of radiation, 

Recall that the frequency of electromagnetic radiation is related to its wavelength and to the speed of light by the fundamental relation  This means that we can express (Figure) equivalently in terms of wavelength
  When included in the computation of the energy density of a blackbody, Planck’s hypothesis gives the following theoretical expression for the power intensity of emitted radiation per unit wavelength:

where c is the speed of light in vacuum and  is Boltzmann’s constant,
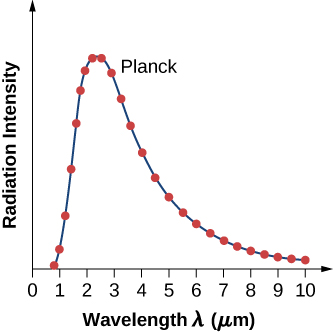
  The theoretical formula expressed in (Figure) is called Planck’s blackbody radiation law. This law is in agreement with the experimental blackbody radiation curve (see (Figure)). In addition, Wien’s displacement law and Stefan’s law can both be derived from (Figure). To derive Wien’s displacement law, we use differential calculus to find the maximum of the radiation intensity curve
  To derive Stefan’s law and find the value of the Stefan–Boltzmann constant, we use integral calculus and integrate to find the total power radiated by a blackbody at one temperature in the entire spectrum of wavelengths from
  to
to  This derivation is left as an exercise later in this chapter.
Example
Planck’s Quantum Oscillator
A quantum oscillator in the cavity wall in (Figure) is vibrating at a frequency of  Calculate the spacing between its energy levels.
Strategy Energy states of a quantum oscillator are given by (Figure). The energy spacing  is obtained by finding the energy difference between two adjacent quantum states for quantum numbers n + 1 and n.
Solution
We can substitute the given frequency and Planck’s constant directly into the equation:

Significance Note that we do not specify what kind of material was used to build the cavity. Here, a quantum oscillator is a theoretical model of an atom or molecule of material in the wall.
Check Your Understanding A molecule is vibrating at a frequency of What is the smallest spacing between its vibrational energy levels?

Example
Quantum Theory Applied to a Classical Oscillator
A 1.0-kg mass oscillates at the end of a spring with a spring constant of 1000 N/m. The amplitude of these oscillations is 0.10 m. Use the concept of quantization to find the energy spacing for this classical oscillator. Is the energy quantization significant for macroscopic systems, such as this oscillator?
Strategy We use (Figure) as though the system were a quantum oscillator, but with the frequency f of the mass vibrating on a spring. To evaluate whether or not quantization has a significant effect, we compare the quantum energy spacing with the macroscopic total energy of this classical oscillator.
Solution
For the spring constant,  the frequency f of the mass,
  is
is

The energy quantum that corresponds to this frequency is

When vibrations have amplitude  the energy of oscillations is

Significance Thus, for a classical oscillator, we have  We see that the separation of the energy levels is immeasurably small. Therefore, for all practical purposes, the energy of a classical oscillator takes on continuous values. This is why classical principles may be applied to macroscopic systems encountered in everyday life without loss of accuracy.
Check Your Understanding Would the result in (Figure) be different if the mass were not 1.0 kg but a tiny mass of 1.0 µg, and the amplitude of vibrations were 0.10 µm?
No, because then 
When Planck first published his result, the hypothesis of energy quanta was not taken seriously by the physics community because it did not follow from any established physics theory at that time. It was perceived, even by Planck himself, as a useful mathematical trick that led to a good theoretical “fit” to the experimental curve. This perception was changed in 1905 when Einstein published his explanation of the photoelectric effect, in which he gave Planck’s energy quantum a new meaning: that of a particle of light.
Summary
- All bodies radiate energy. The amount of radiation a body emits depends on its temperature. The experimental Wien’s displacement law states that the hotter the body, the shorter the wavelength corresponding to the emission peak in the radiation curve. The experimental Stefan’s law states that the total power of radiation emitted across the entire spectrum of wavelengths at a given temperature is proportional to the fourth power of the Kelvin temperature of the radiating body.
- Absorption and emission of radiation are studied within the model of a blackbody. In the classical approach, the exchange of energy between radiation and cavity walls is continuous. The classical approach does not explain the blackbody radiation curve.
- To explain the blackbody radiation curve, Planck assumed that the exchange of energy between radiation and cavity walls takes place only in discrete quanta of energy. Planck’s hypothesis of energy quanta led to the theoretical Planck’s radiation law, which agrees with the experimental blackbody radiation curve; it also explains Wien’s and Stefan’s laws.
Conceptual Questions
Which surface has a higher temperature – the surface of a yellow star or that of a red star?
yellow
Describe what you would see when looking at a body whose temperature is increased from 1000 K to 1,000,000 K.
Explain the color changes in a hot body as its temperature is increased.
goes from red to violet through the rainbow of colors
Speculate as to why UV light causes sunburn, whereas visible light does not.
Two cavity radiators are constructed with walls made of different metals. At the same temperature, how would their radiation spectra differ?
would not differ
Discuss why some bodies appear black, other bodies appear red, and still other bodies appear white.
If everything radiates electromagnetic energy, why can we not see objects at room temperature in a dark room?
human eye does not see IR radiation
How much does the power radiated by a blackbody increase when its temperature (in K) is tripled?
Problems
A 200-W heater emits a 1.5-µm radiation. (a) What value of the energy quantum does it emit? (b) Assuming that the specific heat of a 4.0-kg body is  how many of these photons must be absorbed by the body to increase its temperature by 2 K? (c) How long does the heating process in (b) take, assuming that all radiation emitted by the heater gets absorbed by the body?
a. 0.81 eV; b.  c. 2 min 20 sec
A 900-W microwave generator in an oven generates energy quanta of frequency 2560 MHz. (a) How many energy quanta does it emit per second? (b) How many energy quanta must be absorbed by a pasta dish placed in the radiation cavity to increase its temperature by 45.0 K? Assume that the dish has a mass of 0.5 kg and that its specific heat is  (c) Assume that all energy quanta emitted by the generator are absorbed by the pasta dish. How long must we wait until the dish in (b) is ready?
(a) For what temperature is the peak of blackbody radiation spectrum at 400 nm? (b) If the temperature of a blackbody is 800 K, at what wavelength does it radiate the most energy?
a. 7245 K; b. 3.62 μm
The tungsten elements of incandescent light bulbs operate at 3200 K. At what frequency does the filament radiate maximum energy?
Interstellar space is filled with radiation of wavelength  This radiation is considered to be a remnant of the “big bang.” What is the corresponding blackbody temperature of this radiation?
about 3 K
The radiant energy from the sun reaches its maximum at a wavelength of about 500.0 nm. What is the approximate temperature of the sun’s surface?
Glossary
- absorber
- any object that absorbs radiation
- blackbody
- perfect absorber/emitter
- blackbody radiation
- radiation emitted by a blackbody
- emitter
- any object that emits radiation
- Planck’s hypothesis of energy quanta
- energy exchanges between the radiation and the walls take place only in the form of discrete energy quanta
- power intensity
- energy that passes through a unit surface per unit time
- quantized energies
- discrete energies; not continuous
- quantum state of a Planck’s oscillator
- any mode of vibration of Planck’s oscillator, enumerated by quantum number
- Stefan–Boltzmann constant
- physical constant in Stefan’s law
