
Chapter 7 Work, Energy, and Energy Resources
7.9 World Energy Use
Summary
- Describe the distinction between renewable and nonrenewable energy sources.
- Explain why the inevitable conversion of energy to less useful forms makes it necessary to conserve energy resources.
Energy is an important ingredient in all phases of society. We live in a very interdependent world, and access to adequate and reliable energy resources is crucial for economic growth and for maintaining the quality of our lives. But current levels of energy consumption and production are not sustainable. About 40% of the world’s energy comes from oil, and much of that goes to transportation uses. Oil prices are dependent as much upon new (or foreseen) discoveries as they are upon political events and situations around the world. The U.S., with 4.5% of the world’s population, consumes 24% of the world’s oil production per year; 66% of that oil is imported!
Renewable and Nonrenewable Energy Sources
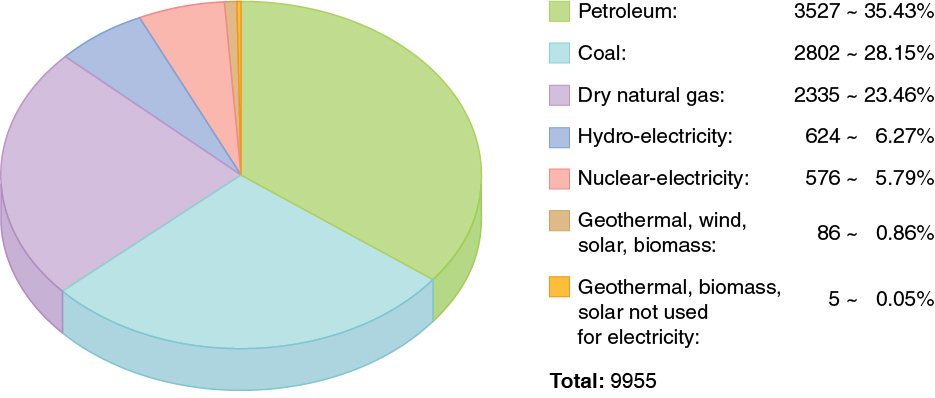
The principal energy resources used in the world are shown in Figure 1. The fuel mix has changed over the years but now is dominated by oil, although natural gas and solar contributions are increasing. Renewable forms of energy are those sources that cannot be used up, such as water, wind, solar, and biomass. About 85% of our energy comes from nonrenewable fossil fuels—oil, natural gas, coal. The likelihood of a link between global warming and fossil fuel use, with its production of carbon dioxide through combustion, has made, in the eyes of many scientists, a shift to non-fossil fuels of utmost importance—but it will not be easy.
The World’s Growing Energy Needs
World energy consumption continues to rise, especially in the developing countries. (See Figure 2.) Global demand for energy has tripled in the past 50 years and might triple again in the next 30 years. While much of this growth will come from the rapidly booming economies of China and India, many of the developed countries, especially those in Europe, are hoping to meet their energy needs by expanding the use of renewable sources. Although presently only a small percentage, renewable energy is growing very fast, especially wind energy. For example, Germany plans to meet 20% of its electricity and 10% of its overall energy needs with renewable resources by the year 2020. (See Figure 3.) Energy is a key constraint in the rapid economic growth of China and India. In 2003, China surpassed Japan as the world’s second largest consumer of oil. However, over 1/3 of this is imported. Unlike most Western countries, coal dominates the commercial energy resources of China, accounting for 2/3 of its energy consumption. In 2009 China surpassed the United States as the largest generator of [latex]\text{CO}_{{2}}.[/latex] In India, the main energy resources are biomass (wood and dung) and coal. Half of India’s oil is imported. About 70% of India’s electricity is generated by highly polluting coal. Yet there are sizeable strides being made in renewable energy. India has a rapidly growing wind energy base, and it has the largest solar cooking program in the world.
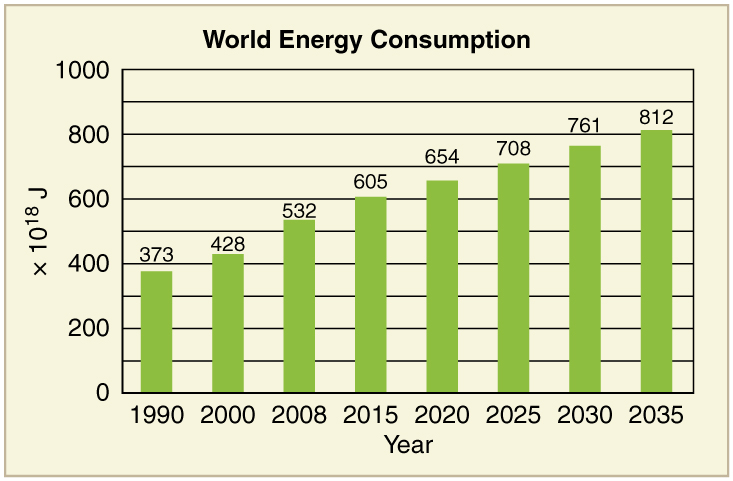

Table 6 displays the 2006 commercial energy mix by country for some of the prime energy users in the world. While non-renewable sources dominate, some countries get a sizeable percentage of their electricity from renewable resources. For example, about 67% of New Zealand’s electricity demand is met by hydroelectric. Only 10% of the U.S. electricity is generated by renewable resources, primarily hydroelectric. It is difficult to determine total contributions of renewable energy in some countries with a large rural population, so these percentages in this table are left blank.
| Country | Consumption, in EJ (1018 J) | Oil | Natural Gas | Coal | Nuclear | Hydro | Other Renewables | Electricity Use per capita (kWh/yr) | Energy Use per capita (GJ/yr) |
|---|---|---|---|---|---|---|---|---|---|
| Australia | 5.4 | 34% | 17% | 44% | 0% | 3% | 1% | 10000 | 260 |
| Brazil | 9.6 | 48% | 7% | 5% | 1% | 35% | 2% | 2000 | 50 |
| China | 63 | 22% | 3% | 69% | 1% | 6% | 1500 | 35 | |
| Egypt | 2.4 | 50% | 41% | 1% | 0% | 6% | 990 | 32 | |
| Germany | 16 | 37% | 24% | 24% | 11% | 1% | 3% | 6400 | 173 |
| India | 15 | 34% | 7% | 52% | 1% | 5% | 470 | 13 | |
| Indonesia | 4.9 | 51% | 26% | 16% | 0% | 2% | 3% | 420 | 22 |
| Japan | 24 | 48% | 14% | 21% | 12% | 4% | 1% | 7100 | 176 |
| New Zealand | 0.44 | 32% | 26% | 6% | 0% | 11% | 19% | 8500 | 102 |
| Russia | 31 | 19% | 53% | 16% | 5% | 6% | 5700 | 202 | |
| U.S. | 105 | 40% | 23% | 22% | 8% | 3% | 1% | 12500 | 340 |
| World | 432 | 39% | 23% | 24% | 6% | 6% | 2% | 2600 | 71 |
| Table 6. Energy Consumption—Selected Countries (2006). | |||||||||
Energy and Economic Well-being
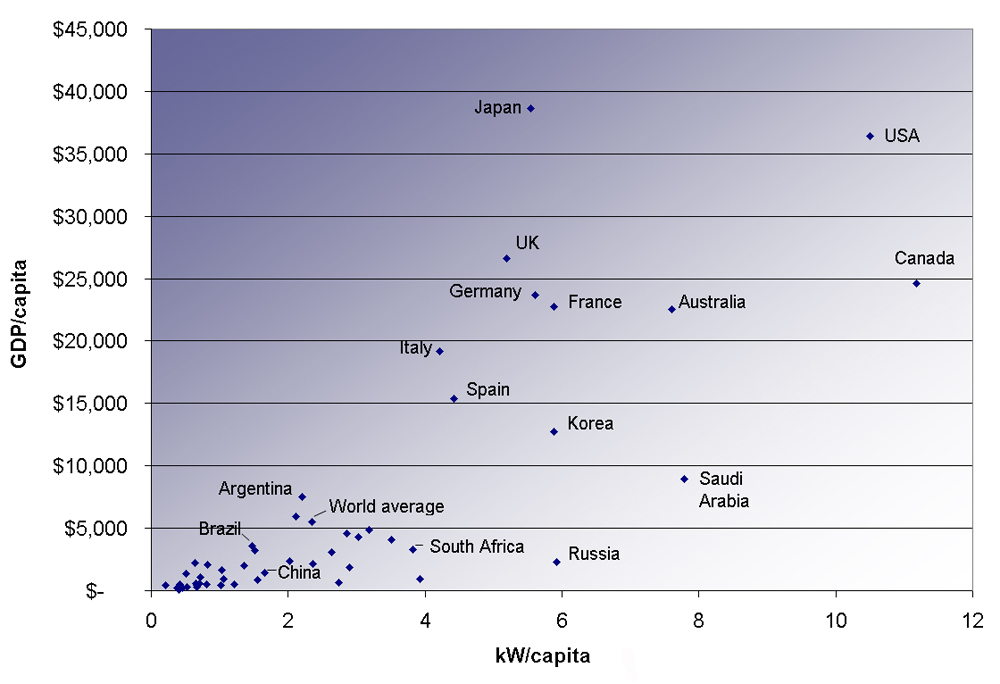
The last two columns in this table examine the energy and electricity use per capita. Economic well-being is dependent upon energy use, and in most countries higher standards of living, as measured by GDP (gross domestic product) per capita, are matched by higher levels of energy consumption per capita. This is borne out in Figure 4. Increased efficiency of energy use will change this dependency. A global problem is balancing energy resource development against the harmful effects upon the environment in its extraction and use.
Conserving Energy
As we finish this chapter on energy and work, it is relevant to draw some distinctions between two sometimes misunderstood terms in the area of energy use. As has been mentioned elsewhere, the “law of the conservation of energy” is a very useful principle in analyzing physical processes. It is a statement that cannot be proven from basic principles, but is a very good bookkeeping device, and no exceptions have ever been found. It states that the total amount of energy in an isolated system will always remain constant. Related to this principle, but remarkably different from it, is the important philosophy of energy conservation. This concept has to do with seeking to decrease the amount of energy used by an individual or group through (1) reduced activities (e.g., turning down thermostats, driving fewer kilometers) and/or (2) increasing conversion efficiencies in the performance of a particular task—such as developing and using more efficient room heaters, cars that have greater miles-per-gallon ratings, energy-efficient compact fluorescent lights, etc.
Since energy in an isolated system is not destroyed or created or generated, one might wonder why we need to be concerned about our energy resources, since energy is a conserved quantity. The problem is that the final result of most energy transformations is waste heat transfer to the environment and conversion to energy forms no longer useful for doing work. To state it in another way, the potential for energy to produce useful work has been “degraded” in the energy transformation. (This will be discussed in more detail in Chapter 15 Thermodynamics.)
Section Summary
- The relative use of different fuels to provide energy has changed over the years, but fuel use is currently dominated by oil, although natural gas and solar contributions are increasing.
- Although non-renewable sources dominate, some countries meet a sizeable percentage of their electricity needs from renewable resources.
- The United States obtains only about 10% of its energy from renewable sources, mostly hydroelectric power.
- Economic well-being is dependent upon energy use, and in most countries higher standards of living, as measured by GDP (Gross Domestic Product) per capita, are matched by higher levels of energy consumption per capita.
- Even though, in accordance with the law of conservation of energy, energy can never be created or destroyed, energy that can be used to do work is always partly converted to less useful forms, such as waste heat to the environment, in all of our uses of energy for practical purposes.
Conceptual Questions
1: What is the difference between energy conservation and the law of conservation of energy? Give some examples of each.
2: If the efficiency of a coal-fired electrical generating plant is 35%, then what do we mean when we say that energy is a conserved quantity?
Problems & Exercises
1: Integrated Concepts
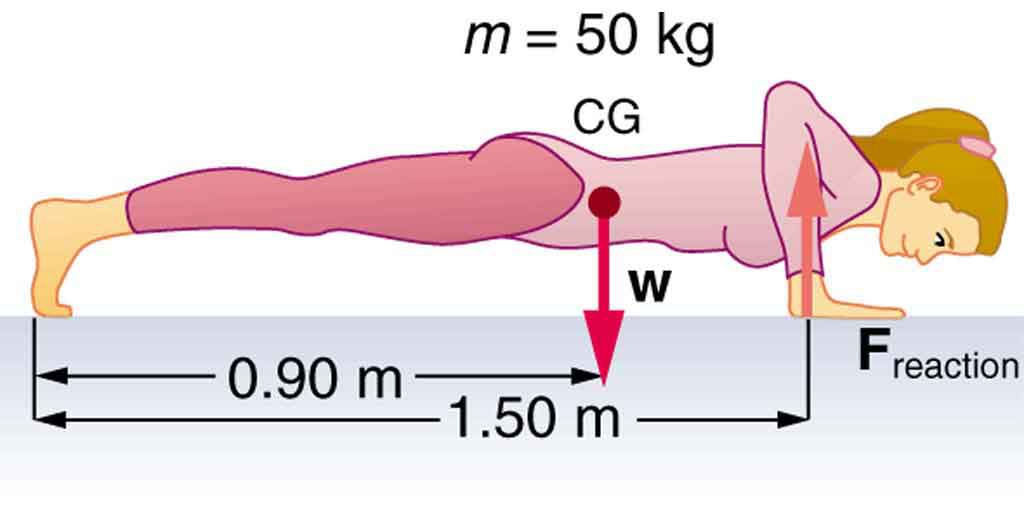
(a) Calculate the force the woman in Figure 5 exerts to do a push-up at constant speed, taking all data to be known to three digits. (b) How much work does she do if her center of mass rises 0.240 m? (c) What is her useful power output if she does 25 push-ups in 1 min? (Should work done lowering her body be included? See the discussion of useful work in Chapter 7.8 Work, Energy, and Power in Humans.
2: Integrated Concepts
A 75.0-kg cross-country skier is climbing a [latex]{3.0^0}[/latex] slope at a constant speed of 2.00 m/s and encounters air resistance of 25.0 N. Find his power output for work done against the gravitational force and air resistance. (b) What average force does he exert backward on the snow to accomplish this? (c) If he continues to exert this force and to experience the same air resistance when he reaches a level area, how long will it take him to reach a velocity of 10.0 m/s?
3: Integrated Concepts
The 70.0-kg swimmer in Chapter 7.8 Work, Energy, and Power in Humans starts a race with an initial velocity of 1.25 m/s and exerts an average force of 80.0 N backward with his arms during each 1.80 m long stroke. (a) What is his initial acceleration if water resistance is 45.0 N? (b) What is the subsequent average resistance force from the water during the 5.00 s it takes him to reach his top velocity of 2.50 m/s? (c) Discuss whether water resistance seems to increase linearly with velocity.
4: Integrated Concepts
A toy gun uses a spring with a force constant of 300 N/m to propel a 10.0-g steel ball. If the spring is compressed 7.00 cm and friction is negligible: (a) How much force is needed to compress the spring? (b) To what maximum height can the ball be shot? (c) At what angles above the horizontal may a child aim to hit a target 3.00 m away at the same height as the gun? (d) What is the gun’s maximum range on level ground?
5: Integrated Concepts
(a) What force must be supplied by an elevator cable to produce an acceleration of [latex]{0.800\text{ m/s}^2}[/latex] against a 200-N frictional force, if the mass of the loaded elevator is 1500 kg? (b) How much work is done by the cable in lifting the elevator 20.0 m? (c) What is the final speed of the elevator if it starts from rest? (d) How much work went into thermal energy?
6: Unreasonable Results
A car advertisement claims that its 900-kg car accelerated from rest to 30.0 m/s and drove 100 km, gaining 3.00 km in altitude, on 1.0 gal of gasoline. The average force of friction including air resistance was 700 N. Assume all values are known to three significant figures. (a) Calculate the car’s efficiency. (b) What is unreasonable about the result? (c) Which premise is unreasonable, or which premises are inconsistent?
7: Unreasonable Results
Body fat is metabolized, supplying 9.30 kcal/g, when dietary intake is less than needed to fuel metabolism. The manufacturers of an exercise bicycle claim that you can lose 0.500 kg of fat per day by vigorously exercising for 2.00 h per day on their machine. (a) How many kcal are supplied by the metabolization of 0.500 kg of fat? (b) Calculate the kcal/min that you would have to utilize to metabolize fat at the rate of 0.500 kg in 2.00 h. (c) What is unreasonable about the results? (d) Which premise is unreasonable, or which premises are inconsistent?
8: Construct Your Own Problem
Consider a person climbing and descending stairs. Construct a problem in which you calculate the long-term rate at which stairs can be climbed considering the mass of the person, his ability to generate power with his legs, and the height of a single stair step. Also consider why the same person can descend stairs at a faster rate for a nearly unlimited time in spite of the fact that very similar forces are exerted going down as going up. (This points to a fundamentally different process for descending versus climbing stairs.)
9: Construct Your Own Problem
Consider humans generating electricity by pedaling a device similar to a stationary bicycle. Construct a problem in which you determine the number of people it would take to replace a large electrical generation facility. Among the things to consider are the power output that is reasonable using the legs, rest time, and the need for electricity 24 hours per day. Discuss the practical implications of your results.
10: Integrated Concepts
A 105-kg basketball player crouches down 0.400 m while waiting to jump. After exerting a force on the floor through this 0.400 m, his feet leave the floor and his center of gravity rises 0.950 m above its normal standing erect position. (a) Using energy considerations, calculate his velocity when he leaves the floor. (b) What average force did he exert on the floor? (Do not neglect the force to support his weight as well as that to accelerate him.) (c) What was his power output during the acceleration phase?
Glossary
- renewable forms of energy
- those sources that cannot be used up, such as water, wind, solar, and biomass
- fossil fuels
- oil, natural gas, and coal
Solutions
Problems & Exercises
1:
(a) 294 N
(b) 118 J
(c) 49.0 W
3:
(a) [latex]{0.500\text{ m /s}^2}[/latex]
(b) [latex]{62.5\text{ N}}[/latex]
(c) Assuming the acceleration of the swimmer decreases linearly with time over the 5.00 s interval, the frictional force must therefore be increasing linearly with time, since [latex]{f=F-ma}.[/latex] If the acceleration decreases linearly with time, the velocity will contain a term dependent on time squared ( [latex]{t^2}[/latex] ). Therefore, the water resistance will not depend linearly on the velocity.
5:
(a) [latex]{16.1\times10^3\text{ N}}[/latex]
(b) [latex]{3.22\times10^5\text{ J}}[/latex]
(c) 5.66 m/s
(d) 4.00 kJ
7:
(a) [latex]{4.65\times10^3\text{ kcal}}[/latex]
(b) 38.8 kcal/min
(c) This power output is higher than the highest value on Table 5, which is about 35 kcal/min (corresponding to 2415 watts) for sprinting.
(d) It would be impossible to maintain this power output for 2 hours (imagine sprinting for 2 hours!).
10:
(a) 4.32 m/s
(b) [latex]{3.47\times10^3\text{ N}}[/latex]
(c) 8.93 kW
