
Chapter 13 Temperature, Kinetic Theory, and the Gas Laws
13.5 Phase Changes
Summary
- Interpret a phase diagram.
- State Dalton’s law.
- Identify and describe the triple point of a gas from its phase diagram.
- Describe the state of equilibrium between a liquid and a gas, a liquid and a solid, and a gas and a solid.
Up to now, we have considered the behavior of ideal gases. Real gases are like ideal gases at high temperatures. At lower temperatures, however, the interactions between the molecules and their volumes cannot be ignored. The molecules are very close (condensation occurs) and there is a dramatic decrease in volume, as seen in Figure 1. The substance changes from a gas to a liquid. When a liquid is cooled to even lower temperatures, it becomes a solid. The volume never reaches zero because of the finite volume of the molecules.
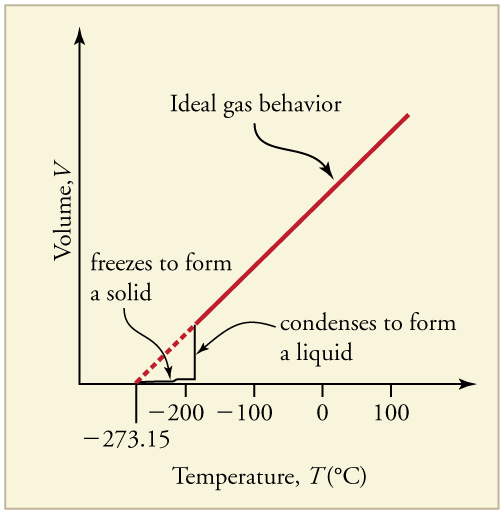
High pressure may also cause a gas to change phase to a liquid. Carbon dioxide, for example, is a gas at room temperature and atmospheric pressure, but becomes a liquid under sufficiently high pressure. If the pressure is reduced, the temperature drops and the liquid carbon dioxide solidifies into a snow-like substance at the temperature [latex]{-78^{\circ}\text{C}}.[/latex] Solid [latex]{\text{CO}_2}[/latex] is called “dry ice.” Another example of a gas that can be in a liquid phase is liquid nitrogen [latex]{(\text{LN}_2)}.\:{\text{LN}_2}[/latex] is made by liquefaction of atmospheric air (through compression and cooling). It boils at 77 K [latex]{(-196^{\circ}\text{C})}[/latex] at atmospheric pressure. [latex]{\text{LN}_2}[/latex] is useful as a refrigerant and allows for the preservation of blood, sperm, and other biological materials. It is also used to reduce noise in electronic sensors and equipment, and to help cool down their current-carrying wires. In dermatology, [latex]{\text{LN}_2}[/latex] is used to freeze and painlessly remove warts and other growths from the skin.
PV Diagrams
We can examine aspects of the behavior of a substance by plotting a graph of pressure versus volume, called a PV diagram. When the substance behaves like an ideal gas, the ideal gas law describes the relationship between its pressure and volume. That is,
Now, assuming the number of molecules and the temperature are fixed,
For example, the volume of the gas will decrease as the pressure increases. If you plot the relationship [latex]{PV=}\text{constant}[/latex] on a [latex]{PV}[/latex] diagram, you find a hyperbola. Figure 2 shows a graph of pressure versus volume. The hyperbolas represent ideal-gas behavior at various fixed temperatures, and are called isotherms. At lower temperatures, the curves begin to look less like hyperbolas—the gas is not behaving ideally and may even contain liquid. There is a critical point—that is, a critical temperature—above which liquid cannot exist. At sufficiently high pressure above the critical point, the gas will have the density of a liquid but will not condense. Carbon dioxide, for example, cannot be liquefied at a temperature above [latex]{31.0^{\circ}\text{C}}.[/latex] Critical pressure is the minimum pressure needed for liquid to exist at the critical temperature. Table 3 lists representative critical temperatures and pressures.
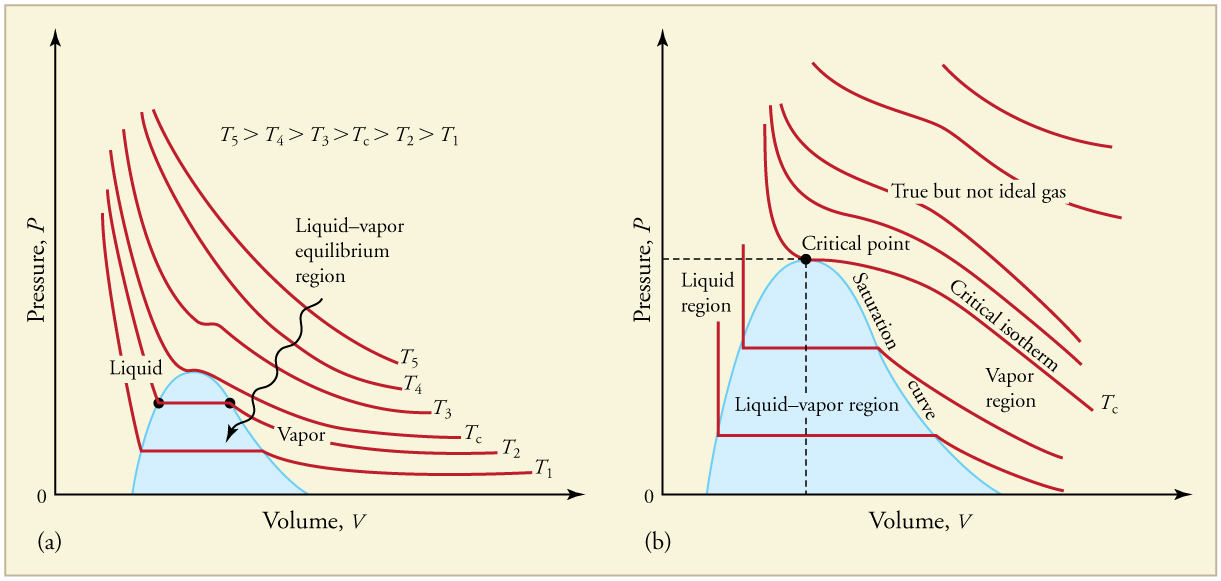
| Substance | Critical temperature | Critical pressure | ||
|---|---|---|---|---|
| K | ºC | Pa | atm |
|
| Water | 647.4 | 374.3 | [latex]{22.12\times10^6}[/latex] | 219.0 |
| Sulfur dioxide | 430.7 | 157.6 | [latex]{7.88\times10^6}[/latex] | 78.0 |
| Ammonia | 405.5 | 132.4 | [latex]{11.28\times10^6}[/latex] | 111.7 |
| Carbon dioxide | 304.2 | 31.1 | [latex]{7.39\times10^6}[/latex] | 73.2 |
| Oxygen | 154.8 | −118.4 | [latex]{5.08\times10^6}[/latex] | 50.3 |
| Nitrogen | 126.2 | −146.9 | [latex]{3.39\times10^6}[/latex] | 33.6 |
| Hydrogen | 33.3 | −239.9 | [latex]{1.30\times10^6}[/latex] | 12.9 |
| Helium | 5.3 | −267.9 | [latex]{0.229\times10^6}[/latex] | 2.27 |
| Table 3. Critical Temperatures and Pressures | ||||
Phase Diagrams
The plots of pressure versus temperatures provide considerable insight into thermal properties of substances. There are well-defined regions on these graphs that correspond to various phases of matter, so [latex]{PT}[/latex] graphs are called phase diagrams. Figure 3 shows the phase diagram for water. Using the graph, if you know the pressure and temperature you can determine the phase of water. The solid lines—boundaries between phases—indicate temperatures and pressures at which the phases coexist (that is, they exist together in ratios, depending on pressure and temperature). For example, the boiling point of water is [latex]{100^{\circ}\text{C}}[/latex] at 1.00 atm. As the pressure increases, the boiling temperature rises steadily to [latex]{374^{\circ}\text{C}}[/latex] at a pressure of 218 atm. A pressure cooker (or even a covered pot) will cook food faster because the water can exist as a liquid at temperatures greater than [latex]{100^{\circ}\text{C}}[/latex] without all boiling away. The curve ends at a point called the critical point, because at higher temperatures the liquid phase does not exist at any pressure. The critical point occurs at the critical temperature, as you can see for water from Table 3. The critical temperature for oxygen is [latex]{-118^{\circ}\text{C}},[/latex] so oxygen cannot be liquefied above this temperature.
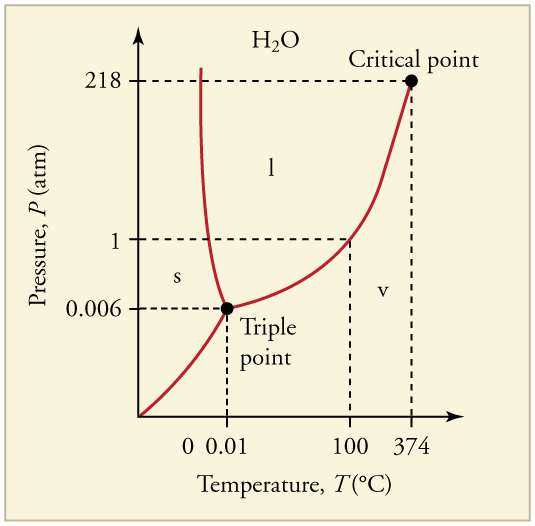
Similarly, the curve between the solid and liquid regions in Figure 3 gives the melting temperature at various pressures. For example, the melting point is [latex]{0^{\circ}\text{C}}[/latex] at 1.00 atm, as expected. Note that, at a fixed temperature, you can change the phase from solid (ice) to liquid (water) by increasing the pressure. Ice melts from pressure in the hands of a snowball maker. From the phase diagram, we can also say that the melting temperature of ice rises with increased pressure. When a car is driven over snow, the increased pressure from the tires melts the snowflakes; afterwards the water refreezes and forms an ice layer.
At sufficiently low pressures there is no liquid phase, but the substance can exist as either gas or solid. For water, there is no liquid phase at pressures below 0.00600 atm. The phase change from solid to gas is called sublimation. It accounts for large losses of snow pack that never make it into a river, the routine automatic defrosting of a freezer, and the freeze-drying process applied to many foods. Carbon dioxide, on the other hand, sublimates at standard atmospheric pressure of 1 atm. (The solid form of [latex]{\text{CO}_2}[/latex] is known as dry ice because it does not melt. Instead, it moves directly from the solid to the gas state.)
All three curves on the phase diagram meet at a single point, the triple point, where all three phases exist in equilibrium. For water, the triple point occurs at 273.16 K [latex]{(0.01^{\circ}\text{C})},[/latex] and is a more accurate calibration temperature than the melting point of water at 1.00 atm, or 273.15 K [latex]{(0.0^{\circ}\text{C})}.[/latex] See Table 4 for the triple point values of other substances.
Equilibrium
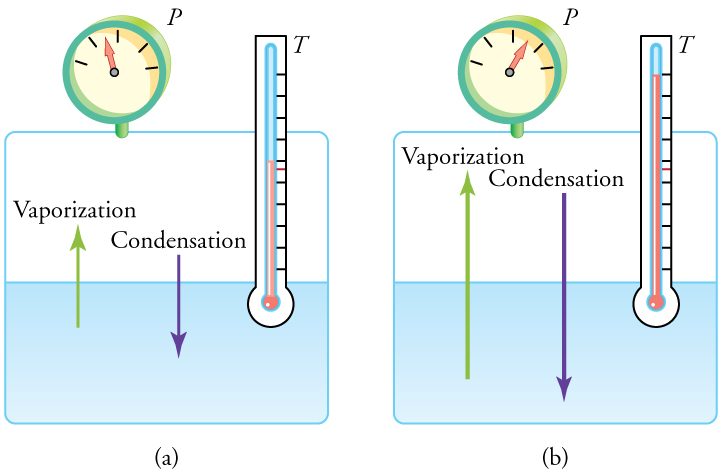
Liquid and gas phases are in equilibrium at the boiling temperature. (See Figure 4.) If a substance is in a closed container at the boiling point, then the liquid is boiling and the gas is condensing at the same rate without net change in their relative amount. Molecules in the liquid escape as a gas at the same rate at which gas molecules stick to the liquid, or form droplets and become part of the liquid phase. The combination of temperature and pressure has to be “just right”; if the temperature and pressure are increased, equilibrium is maintained by the same increase of boiling and condensation rates.
| Substance | Temperature | Pressure | ||
|---|---|---|---|---|
| K | ºC | Pa | atm | |
| Water | 273.16 | 0.01 | [latex]{6.10\times10^2}[/latex] | 0.00600 |
| Carbon dioxide | 216.55 | −56.60 | [latex]{5.16\times10^5}[/latex] | 5.11 |
| Sulfur dioxide | 197.68 | −75.47 | [latex]{1.67\times10^3}[/latex] | 0.0167 |
| Ammonia | 195.40 | −77.75 | [latex]{6.06\times10^3}[/latex] | 0.0600 |
| Nitrogen | 63.18 | −210.0 | [latex]{1.25\times10^4}[/latex] | 0.124 |
| Oxygen | 54.36 | −218.8 | [latex]{1.52\times10^2}[/latex] | 0.00151 |
| Hydrogen | 13.84 | −259.3 | [latex]{7.04\times10^3}[/latex] | 0.0697 |
| Table 4. Triple Point Temperatures and Pressures | ||||
One example of equilibrium between liquid and gas is that of water and steam at [latex]{100^{\circ}\text{C}}[/latex] and 1.00 atm. This temperature is the boiling point at that pressure, so they should exist in equilibrium. Why does an open pot of water at [latex]{100^{\circ}\text{C}}[/latex] boil completely away? The gas surrounding an open pot is not pure water: it is mixed with air. If pure water and steam are in a closed container at [latex]{100^{\circ}\text{C}}[/latex] and 1.00 atm, they would coexist—but with air over the pot, there are fewer water molecules to condense, and water boils. What about water at [latex]{20.0^{\circ}\text{C}}[/latex] and 1.00 atm? This temperature and pressure correspond to the liquid region, yet an open glass of water at this temperature will completely evaporate. Again, the gas around it is air and not pure water vapor, so that the reduced evaporation rate is greater than the condensation rate of water from dry air. If the glass is sealed, then the liquid phase remains. We call the gas phase a vapor when it exists, as it does for water at [latex]{20.0^{\circ}\text{C}},[/latex] at a temperature below the boiling temperature.
Check Your Understanding 1
Explain why a cup of water (or soda) with ice cubes stays at [latex]{0^{\circ}\text{C}},[/latex] even on a hot summer day.
Vapor Pressure, Partial Pressure, and Dalton’s Law
Vapor pressure is defined as the pressure at which a gas coexists with its solid or liquid phase. Vapor pressure is created by faster molecules that break away from the liquid or solid and enter the gas phase. The vapor pressure of a substance depends on both the substance and its temperature—an increase in temperature increases the vapor pressure.
Partial pressure is defined as the pressure a gas would create if it occupied the total volume available. In a mixture of gases, the total pressure is the sum of partial pressures of the component gases, assuming ideal gas behavior and no chemical reactions between the components. This law is known as Dalton’s law of partial pressures, after the English scientist John Dalton (1766–1844), who proposed it. Dalton’s law is based on kinetic theory, where each gas creates its pressure by molecular collisions, independent of other gases present. It is consistent with the fact that pressures add according to Chapter 11.5 Pascal’s Principle. Thus water evaporates and ice sublimates when their vapor pressures exceed the partial pressure of water vapor in the surrounding mixture of gases. If their vapor pressures are less than the partial pressure of water vapor in the surrounding gas, liquid droplets or ice crystals (frost) form.
Check Your Understanding 2
Is energy transfer involved in a phase change? If so, will energy have to be supplied to change phase from solid to liquid and liquid to gas? What about gas to liquid and liquid to solid? Why do they spray the orange trees with water in Florida when the temperatures are near or just below freezing?
PHET EXPLORATIONS: STATES OF MATTER—BASICS
Heat, cool, and compress atoms and molecules and watch as they change between solid, liquid, and gas phases.
Section Summary
- Most substances have three distinct phases: gas, liquid, and solid.
- Phase changes among the various phases of matter depend on temperature and pressure.
- The existence of the three phases with respect to pressure and temperature can be described in a phase diagram.
- Two phases coexist (i.e., they are in thermal equilibrium) at a set of pressures and temperatures. These are described as a line on a phase diagram.
- The three phases coexist at a single pressure and temperature. This is known as the triple point and is described by a single point on a phase diagram.
- A gas at a temperature below its boiling point is called a vapor.
- Vapor pressure is the pressure at which a gas coexists with its solid or liquid phase.
- Partial pressure is the pressure a gas would create if it existed alone.
- Dalton’s law states that the total pressure is the sum of the partial pressures of all of the gases present.
Conceptual Questions
1: A pressure cooker contains water and steam in equilibrium at a pressure greater than atmospheric pressure. How does this greater pressure increase cooking speed?
2: Why does condensation form most rapidly on the coldest object in a room—for example, on a glass of ice water?
3: What is the vapor pressure of solid carbon dioxide (dry ice) at [latex]{-78.5^{\circ}\text{C}}?[/latex]
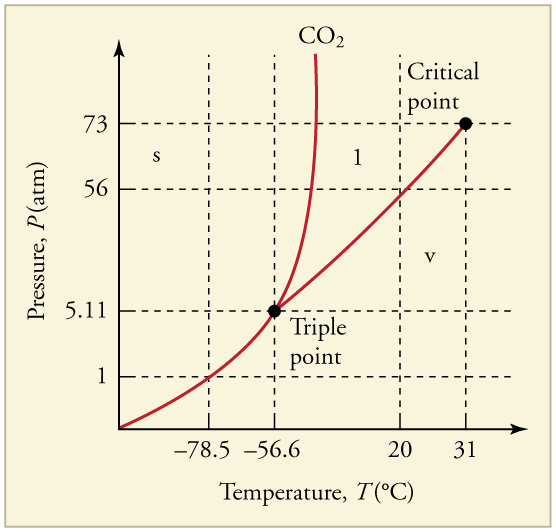
4: Can carbon dioxide be liquefied at room temperature ( [latex]{20^{\circ}\text{C}}[/latex] )? If so, how? If not, why not? (See Figure 6.)
5: Oxygen cannot be liquefied at room temperature by placing it under a large enough pressure to force its molecules together. Explain why this is.
6: What is the distinction between gas and vapor?
Glossary
- PV diagram
- a graph of pressure vs. volume
- critical point
- the temperature above which a liquid cannot exist
- critical temperature
- the temperature above which a liquid cannot exist
- critical pressure
- the minimum pressure needed for a liquid to exist at the critical temperature
- vapor
- a gas at a temperature below the boiling temperature
- vapor pressure
- the pressure at which a gas coexists with its solid or liquid phase
- phase diagram
- a graph of pressure vs. temperature of a particular substance, showing at which pressures and temperatures the three phases of the substance occur
- triple point
- the pressure and temperature at which a substance exists in equilibrium as a solid, liquid, and gas
- sublimation
- the phase change from solid to gas
- partial pressure
- the pressure a gas would create if it occupied the total volume of space available
- Dalton’s law of partial pressures
- the physical law that states that the total pressure of a gas is the sum of partial pressures of the component gases
Solutions
Check Your Understanding 1
The ice and liquid water are in thermal equilibrium, so that the temperature stays at the freezing temperature as long as ice remains in the liquid. (Once all of the ice melts, the water temperature will start to rise.)
Check Your Understanding 2
Yes, energy transfer is involved in a phase change. We know that atoms and molecules in solids and liquids are bound to each other because we know that force is required to separate them. So in a phase change from solid to liquid and liquid to gas, a force must be exerted, perhaps by collision, to separate atoms and molecules. Force exerted through a distance is work, and energy is needed to do work to go from solid to liquid and liquid to gas. This is intuitively consistent with the need for energy to melt ice or boil water. The converse is also true. Going from gas to liquid or liquid to solid involves atoms and molecules pushing together, doing work and releasing energy.
