
46.2 Energy Flow Through Ecosystems
Learning Objectives
- Describe how organisms acquire energy in a food web and in associated food chains
- Explain how the efficiency of energy transfers between trophic levels affects ecosystem structure and dynamics
All living things require energy in one form or another. Energy is required by most complex metabolic pathways (often in the form of adenosine triphosphate, ATP), especially those responsible for building large molecules from smaller compounds, and life itself is an energy-driven process. Living organisms would not be able to assemble macromolecules (proteins, lipids, nucleic acids, and complex carbohydrates) from their monomeric subunits without a constant energy input.
It is important to understand how organisms acquire energy and how that energy is passed from one organism to another through food webs and their constituent food chains. Food webs illustrate how energy flows directionally through ecosystems, including how efficiently organisms acquire it, use it, and how much remains for use by other organisms of the food web.
How Organisms Acquire Energy in a Food Web
Energy is acquired by living things in three ways: photosynthesis, chemosynthesis, and the consumption and digestion of other living or previously living organisms by heterotrophs.
Photosynthetic and chemosynthetic organisms are both grouped into a category known as autotrophs: organisms capable of synthesizing their own food (more specifically, capable of using inorganic carbon as a carbon source). Photosynthetic autotrophs (photoautotrophs) use sunlight as an energy source, whereas chemosynthetic autotrophs (chemoautotrophs) use inorganic molecules as an energy source. Autotrophs are critical for all ecosystems. Without these organisms, energy would not be available to other living organisms and life itself would not be possible.
Photoautotrophs, such as plants, algae, and photosynthetic bacteria, serve as the energy source for a majority of the world’s ecosystems. These ecosystems are often described by grazing food webs. Photoautotrophs harness the solar energy of the sun by converting it to chemical energy in the form of ATP (and NADP). The energy stored in ATP is used to synthesize complex organic molecules, such as glucose.
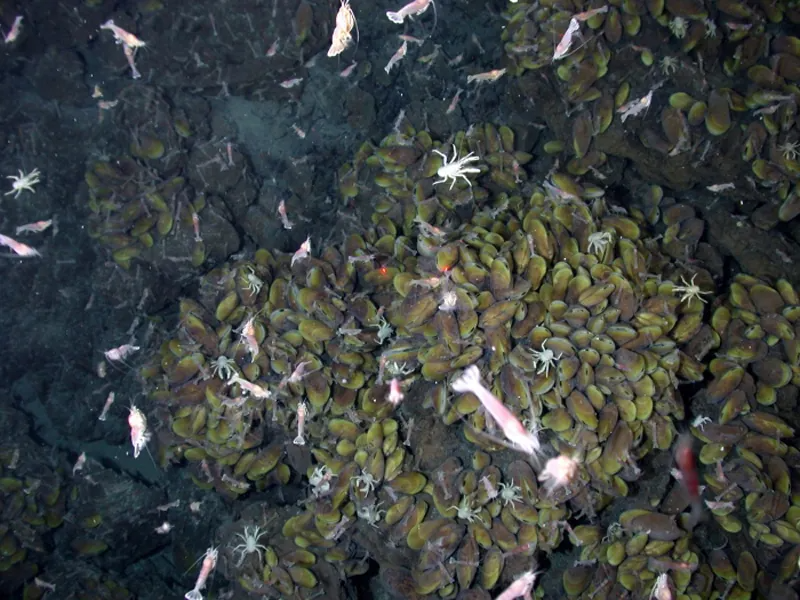
Chemoautotrophs are primarily bacteria that are found in rare ecosystems where sunlight is not available, such as in those associated with dark caves or hydrothermal vents at the bottom of the ocean (Figure 46.9). Many chemoautotrophs in hydrothermal vents use hydrogen sulfide (H2S), which is released from the vents as a source of chemical energy. This allows chemoautotrophs to synthesize complex organic molecules, such as glucose, for their own energy and in turn supplies energy to the rest of the ecosystem.
Productivity within Trophic Levels
Productivity within an ecosystem can be defined as the percentage of energy entering the ecosystem incorporated into biomass in a particular trophic level. Biomass is the total mass, in a unit area at the time of measurement, of living or previously living organisms within a trophic level. Ecosystems have characteristic amounts of biomass at each trophic level. For example, in the English Channel ecosystem the primary producers account for a biomass of 4 g/m2 (grams per square meter), while the primary consumers exhibit a biomass of 21 g/m2.
The productivity of the primary producers is especially important in any ecosystem because these organisms bring energy to other living organisms by photoautotrophy or chemoautotrophy. The rate at which photosynthetic primary producers incorporate energy from the sun is called gross primary productivity. An example of gross primary productivity is shown in the compartment diagram of energy flow within the Silver Springs aquatic ecosystem as shown (Figure 46.8.). In this ecosystem, the total energy accumulated by the primary producers (gross primary productivity) was shown to be 20,810 kcal/m2/yr.
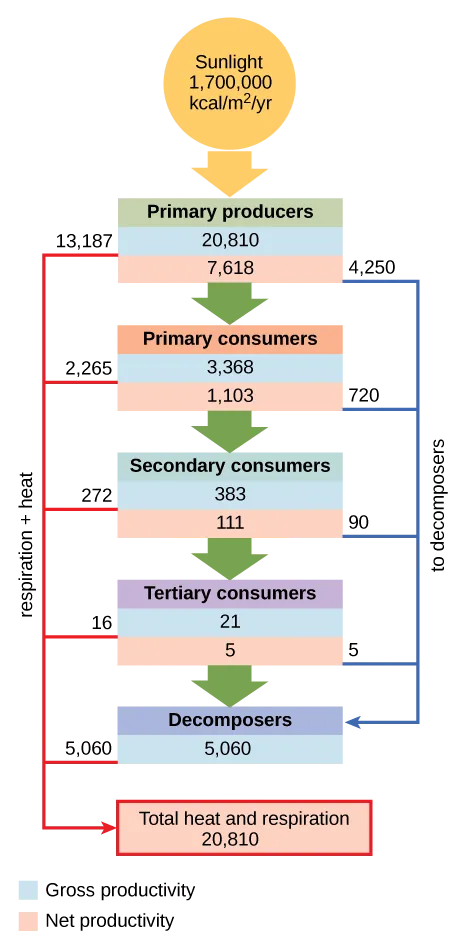
Because all organisms need to use some of this energy for their own functions (like respiration and resulting metabolic heat loss) scientists often refer to the net primary productivity of an ecosystem. Net primary productivity is the energy that remains in the primary producers after accounting for the organisms’ respiration and heat loss. The net productivity is then available to the primary consumers at the next trophic level. In our Silver Springs example, 13,187 of the 20,810 kcal/m2/yr were used for respiration or were lost as heat, leaving 7,633 kcal/m2/yr of energy for use by the primary consumers.
Consequences of Food Webs: Biological Magnification
One of the most important environmental consequences of ecosystem dynamics is biomagnification. Biomagnification is the increasing concentration of persistent, toxic substances in organisms at each trophic level, from the primary producers to the apex consumers. Many substances have been shown to bioaccumulate, including the pesticide dichlorodiphenyltrichloroethane (DDT), which was described in the 1960s bestseller, Silent Spring, by Rachel Carson. DDT was a commonly used pesticide before its dangers became known. In some aquatic ecosystems, organisms from each trophic level consumed many organisms of the lower level, which caused DDT to increase in birds (apex consumers) that ate fish. Thus, the birds accumulated sufficient amounts of DDT to cause fragility in their eggshells. This effect increased egg breakage during nesting and was shown to have adverse effects on these bird populations. The use of DDT was banned in the United States in the 1970s.
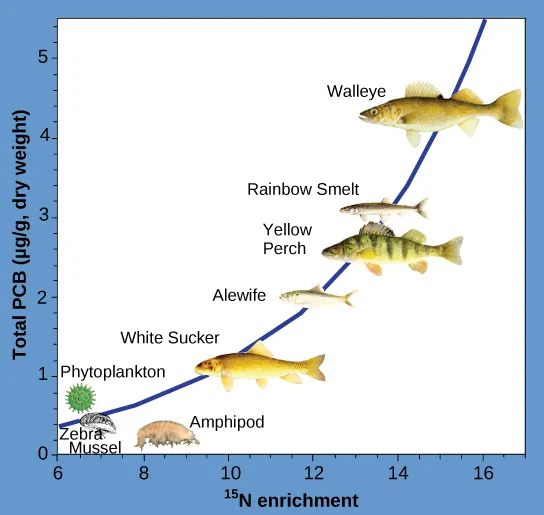
Other substances that biomagnify are polychlorinated biphenyls (PCBs), which were used in coolant liquids in the United States until their use was banned in 1979, and heavy metals, such as mercury, lead, and cadmium. These substances were best studied in aquatic ecosystems, where fish species at different trophic levels accumulate toxic substances brought through the ecosystem by the primary producers. As illustrated in a study performed by the National Oceanic and Atmospheric Administration (NOAA) in the Saginaw Bay of Lake Huron (Figure 46.11), PCB concentrations increased from the ecosystem’s primary producers (phytoplankton) through the different trophic levels of fish species. The apex consumer (walleye) has more than four times the amount of PCBs compared to phytoplankton. Also, based on results from other studies, birds that eat these fish may have PCB levels at least one order of magnitude higher than those found in the lake fish.
Other concerns have been raised by the accumulation of heavy metals, such as mercury and cadmium, in certain types of seafood. The United States Environmental Protection Agency (EPA) recommends that pregnant women and young children should not consume any swordfish, shark, king mackerel, or tilefish because of their high mercury content. These individuals are advised to eat fish low in mercury: salmon, tilapia, shrimp, pollock, and catfish. Biomagnification is a good example of how ecosystem dynamics can affect our everyday lives, even influencing the food we eat.
