
46.1 Ecology of Ecosystems
Learning Objectives
- Describe the basic ecosystem types
- Explain the methods that ecologists use to study ecosystem structure and dynamics
- Identify the different methods of ecosystem modeling
- Differentiate between food chains and food webs and recognize the importance of each
Life in an ecosystem is often about competition for limited resources, a characteristic of the theory of natural selection. Competition in communities (all living things within specific habitats) is observed both within species and among different species. The resources for which organisms compete include organic material, sunlight, and mineral nutrients, which provide the energy for living processes and the matter to make up organisms’ physical structures. Other critical factors influencing community dynamics are the components of its physical and geographic environment: a habitat’s latitude, amount of rainfall, topography (elevation), and available species. These are all important environmental variables that determine which organisms can exist within a particular area.
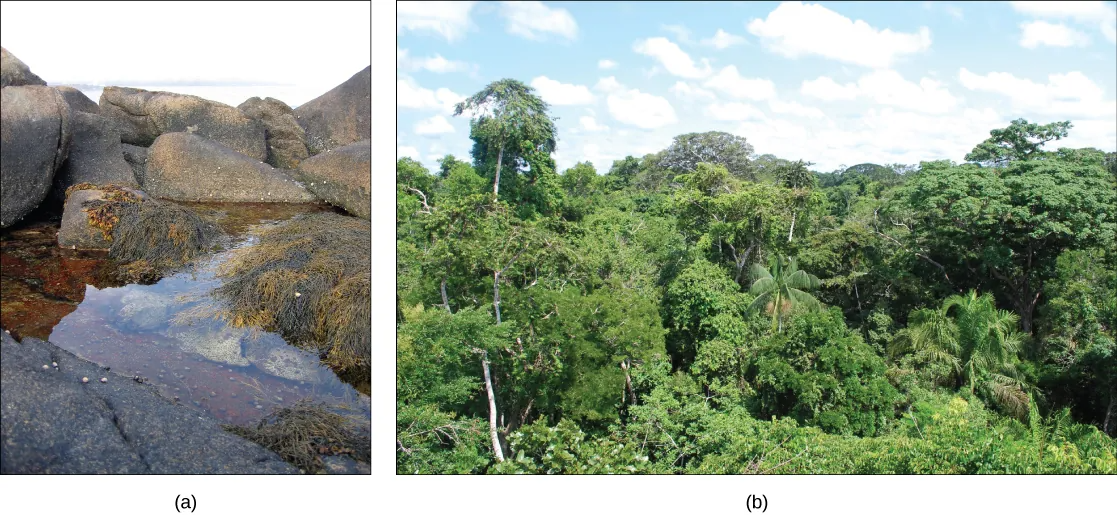
An ecosystem is a community of living organisms and their interactions with their abiotic (nonliving) environment. Ecosystems can be small, such as the tide pools found near the rocky shores of many oceans, or large, such as the Amazon Rainforest in Brazil (Figure 46.2).
There are three broad categories of ecosystems based on their general environment: freshwater, ocean water, and terrestrial. Within these broad categories are individual ecosystem types based on the organisms present and the type of environmental habitat.
Ocean ecosystems are the most common, comprising over 70 percent of the Earth’s surface and consisting of three basic types: shallow ocean, deep ocean water, and deep ocean surfaces (the low depth areas of the deep oceans). The shallow ocean ecosystems include extremely biodiverse coral reef ecosystems, and the deep ocean surface is known for its large numbers of plankton and krill (small crustaceans) that support it. These two environments are especially important to aerobic respirators worldwide as the phytoplankton perform 40 percent of all photosynthesis on Earth. Although not as diverse as the other two, deep ocean ecosystems contain a wide variety of marine organisms. Such ecosystems exist even at the bottom of the ocean where light is unable to penetrate through the water.
Freshwater ecosystems are the rarest, occurring on only 1.8 percent of the Earth’s surface. Lakes, rivers, streams, and springs comprise these systems. They are quite diverse, and they support a variety of fish, amphibians, reptiles, insects, phytoplankton, fungi, and bacteria.
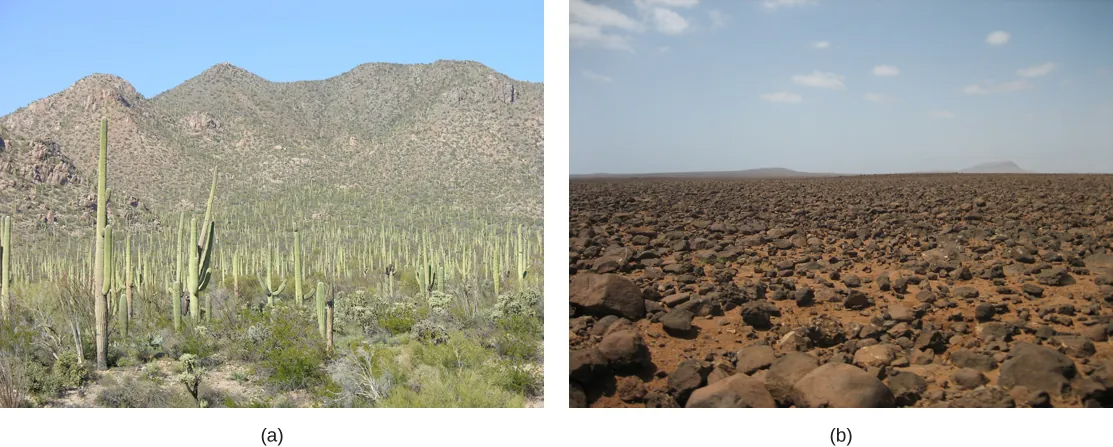
Terrestrial ecosystems, also known for their diversity, are grouped into large categories called biomes, such as tropical rain forests, savannas, deserts, coniferous forests, deciduous forests, and tundra. Grouping these ecosystems into just a few biome categories obscures the great diversity of the individual ecosystems within them. For example, there is great variation in desert vegetation: the saguaro cacti and other plant life in the Sonoran Desert, in the United States, are relatively abundant compared to the desolate rocky desert of Boa Vista, an island off the coast of Western Africa (Figure 46.3).
Ecosystems are complex with many interacting parts. They are routinely exposed to various disturbances, or changes in the environment that effect their compositions: yearly variations in rainfall and temperature and the slower processes of plant growth, which may take several years. Many of these disturbances result from natural processes. For example, when lightning causes a forest fire and destroys part of a forest ecosystem, the ground is eventually populated by grasses, then by bushes and shrubs, and later by mature trees, restoring the forest to its former state. The impact of environmental disturbances caused by human activities is as important as the changes wrought by natural processes. Human agricultural practices, air pollution, acid rain, global deforestation, overfishing, eutrophication, oil spills, and waste dumping on land and into the ocean are all issues of concern to conservationists.
Equilibrium is the steady state of an ecosystem where all organisms are in balance with their environment and with each other. In ecology, two parameters are used to measure changes in ecosystems: resistance and resilience. Resistance is the ability of an ecosystem to remain at equilibrium in spite of disturbances. Resilience is the speed at which an ecosystem recovers equilibrium after being disturbed. Ecosystem resistance and resilience are especially important when considering human impact. The nature of an ecosystem may change to such a degree that it can lose its resilience entirely. This process can lead to the complete destruction or irreversible altering of the ecosystem.
Food Chains and Food Webs
In ecology, a food chain is a linear sequence of organisms through which nutrients and energy pass: primary producers, primary consumers, and higher-level consumers are used to describe ecosystem structure and dynamics. There is a single path through the chain. Each organism in a food chain occupies what is called a trophic level. Depending on their role as producers or consumers, species or groups of species can be assigned to various trophic levels.
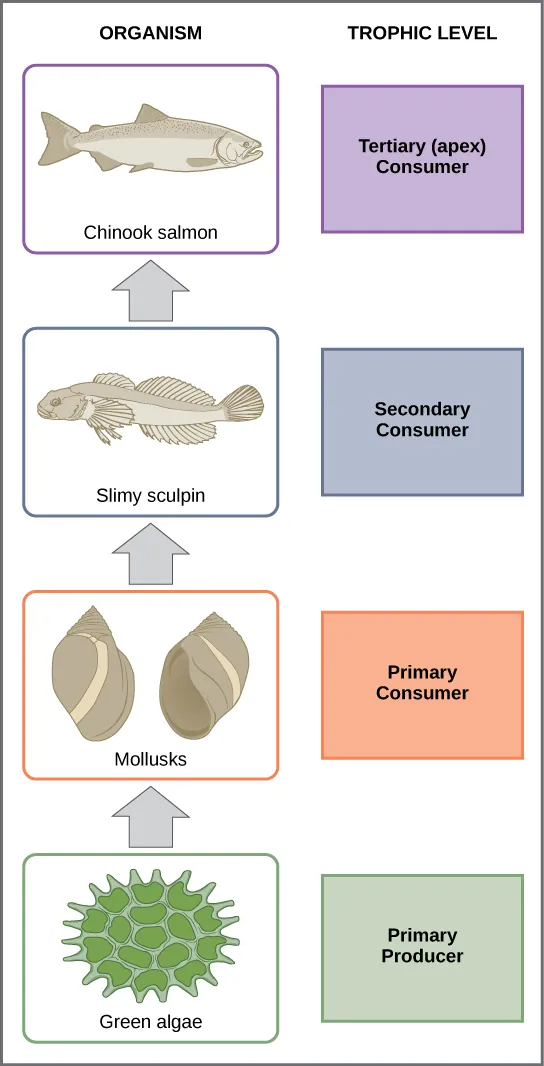
In many ecosystems, the bottom of the food chain consists of photosynthetic organisms (plants and/or phytoplankton), which are called primary producers. The organisms that consume the primary producers are herbivores: the primary consumers. Secondary consumers are usually carnivores that eat the primary consumers. Tertiary consumers are carnivores that eat other carnivores. Higher-level consumers feed on the next lower tropic levels, and so on, up to the organisms at the top of the food chain: the apex consumers. In the Lake Ontario food chain shown in Figure 46.4, the Chinook salmon is the apex consumer at the top of this food chain.
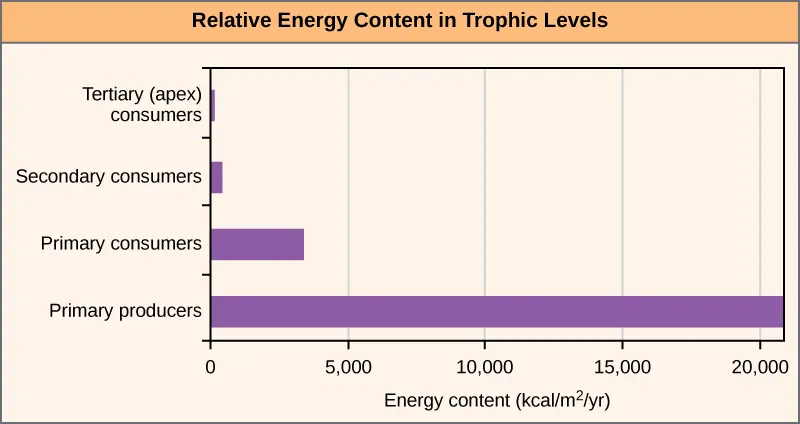
The loss of energy between trophic levels is illustrated by the pioneering studies of Howard T. Odum in the Silver Springs, Florida, ecosystem in the 1940s (Figure 46.5). The primary producers generated 20,819 kcal/m2/yr (kilocalories per square meter per year), the primary consumers generated 3368 kcal/m2/yr, the secondary consumers generated 383 kcal/m2/yr, and the tertiary consumers only generated 21 kcal/m2/yr. Thus, there is little energy remaining for another level of consumers in this ecosystem.
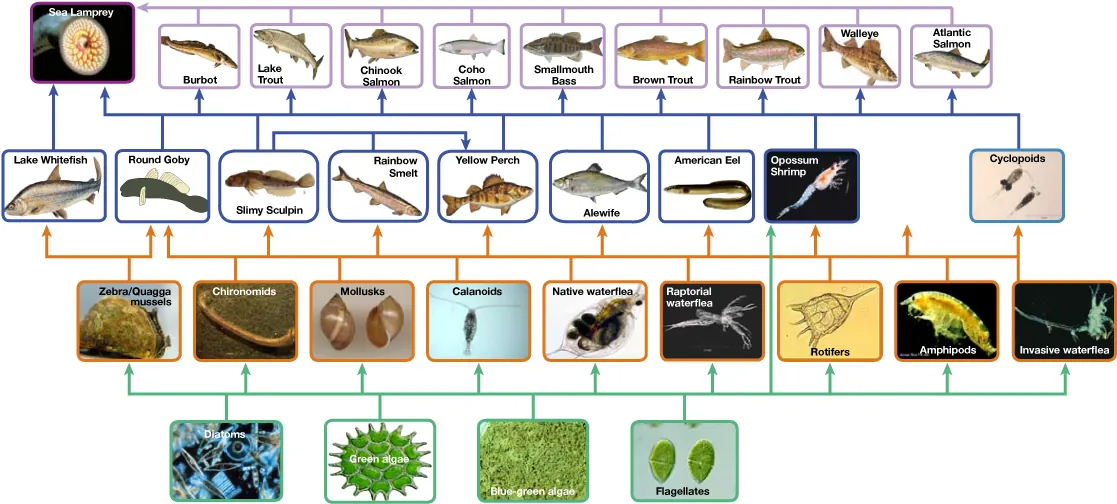
There is a one problem when using food chains to accurately describe most ecosystems. Even when all organisms are grouped into appropriate trophic levels, some of these organisms can feed on species from more than one trophic level; likewise, some of these organisms can be eaten by species from multiple trophic levels. In other words, the linear model of ecosystems, the food chain, is not completely descriptive of ecosystem structure. A holistic model—which accounts for all the interactions between different species and their complex interconnected relationships with each other and with the environment—is a more accurate and descriptive model for ecosystems. A food web is a graphic representation of a holistic, nonlinear web of primary producers, primary consumers, and higher-level consumers used to describe ecosystem structure and dynamics (Figure 46.6).
A comparison of the two types of structural ecosystem models shows strength in both. Food chains are more flexible for analytical modeling, are easier to follow, and are easier to experiment with, whereas food web models more accurately represent ecosystem structure and dynamics, and data can be directly used as input for simulation modeling.
Two general types of food webs are often shown interacting within a single ecosystem. A grazing food web (such as the Lake Ontario food web in Figure 46.6) has plants or other photosynthetic organisms at its base, followed by herbivores and various carnivores. A detrital food web consists of a base of organisms that feed on decaying organic matter (dead organisms), called decomposers or detritivores. These organisms are usually bacteria or fungi that recycle organic material back into the biotic part of the ecosystem as they themselves are consumed by other organisms. As all ecosystems require a method to recycle material from dead organisms, most grazing food webs have an associated detrital food web. For example, in a meadow ecosystem, plants may support a grazing food web of different organisms, primary and other levels of consumers, while at the same time supporting a detrital food web of bacteria, fungi, and detrivorous invertebrates feeding off dead plants and animals.
Research into Ecosystem Dynamics: Ecosystem Experimentation and Modeling
The study of the changes in ecosystem structure caused by changes in the environment (disturbances) or by internal forces is called ecosystem dynamics. Ecosystems are characterized using a variety of research methodologies. Some ecologists study ecosystems using controlled experimental systems, while some study entire ecosystems in their natural state, and others use both approaches.
A holistic ecosystem model attempts to quantify the composition, interaction, and dynamics of entire ecosystems; it is the most representative of the ecosystem in its natural state. A food web is an example of a holistic ecosystem model. However, this type of study is limited by time and expense, as well as the fact that it is neither feasible nor ethical to do experiments on large natural ecosystems. It is difficult to quantify all different species in an ecosystem and the dynamics in their habitat, especially when studying large habitats such as the Amazon Rainforest.
For these reasons, scientists study ecosystems under more controlled conditions. Experimental systems usually involve either partitioning a part of a natural ecosystem that can be used for experiments, termed a mesocosm, or by recreating an ecosystem entirely in an indoor or outdoor laboratory environment, which is referred to as a microcosm. A major limitation to these approaches is that removing individual organisms from their natural ecosystem or altering a natural ecosystem through partitioning may change the dynamics of the ecosystem. These changes are often due to differences in species numbers and diversity and also to environment alterations caused by partitioning (mesocosm) or recreating (microcosm) the natural habitat. Thus, these types of experiments are not totally predictive of changes that would occur in the ecosystem from which they were gathered.
As both of these approaches have their limitations, some ecologists suggest that results from these experimental systems should be used only in conjunction with holistic ecosystem studies to obtain the most representative data about ecosystem structure, function, and dynamics.
Scientists use the data generated by these experimental studies to develop ecosystem models that demonstrate the structure and dynamics of ecosystems. They use three basic types of ecosystem modeling in research and ecosystem management: a conceptual model, an analytical model, and a simulation model. A conceptual model is an ecosystem model that consists of flow charts to show interactions of different compartments of the living and nonliving components of the ecosystem. A conceptual model describes ecosystem structure and dynamics and shows how environmental disturbances affect the ecosystem; however, its ability to predict the effects of these disturbances is limited. Analytical and simulation models, in contrast, are mathematical methods of describing ecosystems that are indeed capable of predicting the effects of potential environmental changes without direct experimentation, although with some limitations as to accuracy. An analytical model is an ecosystem model that is created using simple mathematical formulas to predict the effects of environmental disturbances on ecosystem structure and dynamics. A simulation model is an ecosystem model that is created using complex computer algorithms to holistically model ecosystems and to predict the effects of environmental disturbances on ecosystem structure and dynamics. Ideally, these models are accurate enough to determine which components of the ecosystem are particularly sensitive to disturbances, and they can serve as a guide to ecosystem managers (such as conservation ecologists or fisheries biologists) in the practical maintenance of ecosystem health.
