
Chapter 3: American Federalism
The Division of Powers
Learning Objectives
By the end of this section, you will be able to:
- Explain the concept of federalism
- Discuss the constitutional logic of federalism
- Identify the powers and responsibilities of federal, state, and local governments
Modern democracies divide governmental power in two general ways; some, like the United States, use a combination of both structures. The first and more common mechanism shares power among three branches of government—the legislature, the executive, and the judiciary. The second, federalism, apportions power between two levels of government: national and subnational. In the United States, the term federal government refers to the government at the national level, while the term states means governments at the subnational level.
FEDERALISM DEFINED AND CONTRASTED
Federalism is an institutional arrangement that creates two relatively autonomous levels of government, each possessing the capacity to act directly on behalf of the people with the authority granted to it by the national constitution.[1]
Although today’s federal systems vary in design, five structural characteristics are common to the United States and other federal systems around the world, including Germany and Mexico.
First, all federal systems establish two levels of government, with both levels being elected by the people and each level assigned different functions. The national government is responsible for handling matters that affect the country as a whole, for example, defending the nation against foreign threats and promoting national economic prosperity. Subnational, or state governments, are responsible for matters that lie within their regions, which include ensuring the well-being of their people by administering education, health care, public safety, and other public services. By definition, a system like this requires that different levels of government cooperate, because the institutions at each level form an interacting network. In the U.S. federal system, all national matters are handled by the federal government, which is led by the president and members of Congress, all of whom are elected by voters across the country. All matters at the subnational level are the responsibility of the fifty states, each headed by an elected governor and legislature. Thus, there is a separation of functions between the federal and state governments, and voters choose the leader at each level.[2]
The second characteristic common to all federal systems is a written national constitution that cannot be changed without the substantial consent of subnational governments. In the American federal system, the twenty-seven amendments added to the Constitution since its adoption were the result of an arduous process that required approval by two-thirds of both houses of Congress and three-fourths of the states. The main advantage of this supermajority requirement is that no changes to the Constitution can occur unless there is broad support within Congress and among states. The potential drawback is that numerous national amendment initiatives—such as the Equal Rights Amendment (ERA), which aims to guarantee equal rights regardless of sex—have failed because they cannot garner sufficient consent among members of Congress or, in the case of the ERA, the states.
Third, the constitutions of countries with federal systems formally allocate legislative, judicial, and executive authority to the two levels of government in such a way as to ensure each level some degree of autonomy from the other. Under the U.S. Constitution, the president assumes executive power, Congress exercises legislative powers, and the federal courts (e.g., U.S. district courts, appellate courts, and the Supreme Court) assume judicial powers. In each of the fifty states, a governor assumes executive authority, a state legislature makes laws, and state-level courts (e.g., trial courts, intermediate appellate courts, and supreme courts) possess judicial authority.
While each level of government is somewhat independent of the others, a great deal of interaction occurs among them. In fact, the ability of the federal and state governments to achieve their objectives often depends on the cooperation of the other level of government. For example, the federal government’s efforts to ensure homeland security are bolstered by the involvement of law enforcement agents working at local and state levels. On the other hand, the ability of states to provide their residents with public education and health care is enhanced by the federal government’s financial assistance.
Another common characteristic of federalism around the world is that national courts commonly resolve disputes between levels and departments of government. In the United States, conflicts between states and the federal government are adjudicated by federal courts, with the U.S. Supreme Court being the final arbiter. The resolution of such disputes can preserve the autonomy of one level of government, as illustrated recently when the Supreme Court ruled that states cannot interfere with the federal government’s actions relating to immigration.[3]
In other instances, a Supreme Court ruling can erode that autonomy, as demonstrated in the 1940s when, in United States v. Wrightwood Dairy Co., the Court enabled the federal government to regulate commercial activities that occurred within states, a function previously handled exclusively by the states.[4]
Finally, subnational governments are always represented in the upper house of the national legislature, enabling regional interests to influence national lawmaking.[5]
In the American federal system, the U.S. Senate functions as a territorial body by representing the fifty states: Each state elects two senators to ensure equal representation regardless of state population differences. Thus, federal laws are shaped in part by state interests, which senators convey to the federal policymaking process.
Division of power can also occur via a unitary structure or confederation (Figure). In contrast to federalism, a unitary system makes subnational governments dependent on the national government, where significant authority is concentrated. Before the late 1990s, the United Kingdom’s unitary system was centralized to the extent that the national government held the most important levers of power. Since then, power has been gradually decentralized through a process of devolution, leading to the creation of regional governments in Scotland, Wales, and Northern Ireland as well as the delegation of specific responsibilities to them. Other democratic countries with unitary systems, such as France, Japan, and Sweden, have followed a similar path of decentralization.
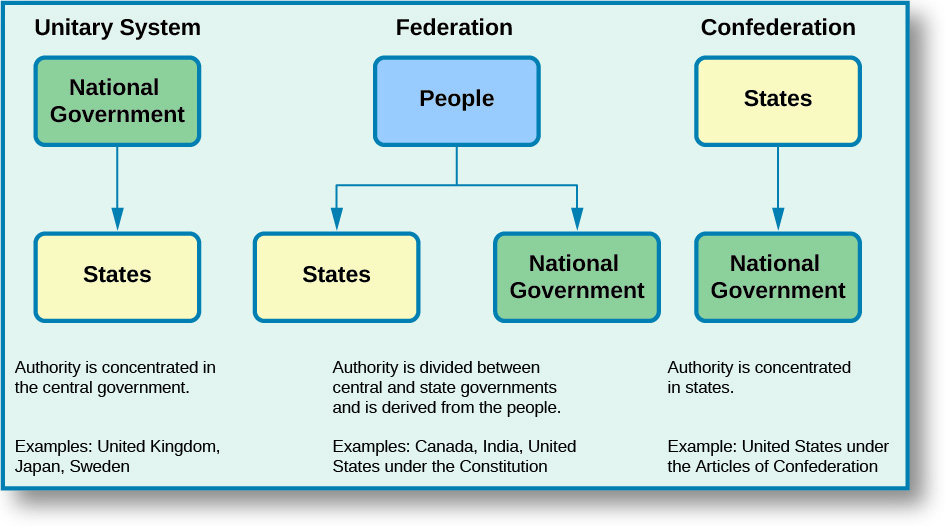
Figure 1. There are three general systems of government—unitary systems, federations, and confederations—each of which allocates power differently.
In a confederation, authority is decentralized, and the central government’s ability to act depends on the consent of the subnational governments. Under the Articles of Confederation (the first constitution of the United States), states were sovereign and powerful while the national government was subordinate and weak. Because states were reluctant to give up any of their power, the national government lacked authority in the face of challenges such as servicing the war debt, ending commercial disputes among states, negotiating trade agreements with other countries, and addressing popular uprisings that were sweeping the country. As the brief American experience with confederation clearly shows, the main drawback with this system of government is that it maximizes regional self-rule at the expense of effective national governance.
FEDERALISM AND THE CONSTITUTION
The Constitution contains several provisions that direct the functioning of U.S. federalism. Some delineate the scope of national and state power, while others restrict it. The remaining provisions shape relationships among the states and between the states and the federal government.
The enumerated powers of the national legislature are found in Article I, Section 8. These powers define the jurisdictional boundaries within which the federal government has authority. In seeking not to replay the problems that plagued the young country under the Articles of Confederation, the Constitution’s framers granted Congress specific powers that ensured its authority over national and foreign affairs. To provide for the general welfare of the populace, it can tax, borrow money, regulate interstate and foreign commerce, and protect property rights, for example. To provide for the common defense of the people, the federal government can raise and support armies and declare war. Furthermore, national integration and unity are fostered with the government’s powers over the coining of money, naturalization, postal services, and other responsibilities.
The last clause of Article I, Section 8, commonly referred to as the elastic clause or the necessary and proper cause, enables Congress “to make all Laws which shall be necessary and proper for carrying” out its constitutional responsibilities. While the enumerated powers define the policy areas in which the national government has authority, the elastic clause allows it to create the legal means to fulfill those responsibilities. However, the open-ended construction of this clause has enabled the national government to expand its authority beyond what is specified in the Constitution, a development also motivated by the expansive interpretation of the commerce clause, which empowers the federal government to regulate interstate economic transactions.
The powers of the state governments were never listed in the original Constitution. The consensus among the framers was that states would retain any powers not prohibited by the Constitution or delegated to the national government.[6]
However, when it came time to ratify the Constitution, a number of states requested that an amendment be added explicitly identifying the reserved powers of the states. What these Anti-Federalists sought was further assurance that the national government’s capacity to act directly on behalf of the people would be restricted, which the first ten amendments (Bill of Rights) provided. The Tenth Amendment affirms the states’ reserved powers: “The powers not delegated to the United States by the Constitution, nor prohibited by it to the States, are reserved to the States respectively, or to the people.” Indeed, state constitutions had bills of rights, which the first Congress used as the source for the first ten amendments to the Constitution.
Some of the states’ reserved powers are no longer exclusively within state domain, however. For example, since the 1940s, the federal government has also engaged in administering health, safety, income security, education, and welfare to state residents. The boundary between intrastate and interstate commerce has become indefinable as a result of broad interpretation of the commerce clause. Shared and overlapping powers have become an integral part of contemporary U.S. federalism. These concurrent powers range from taxing, borrowing, and making and enforcing laws to establishing court systems (Figure).[7]
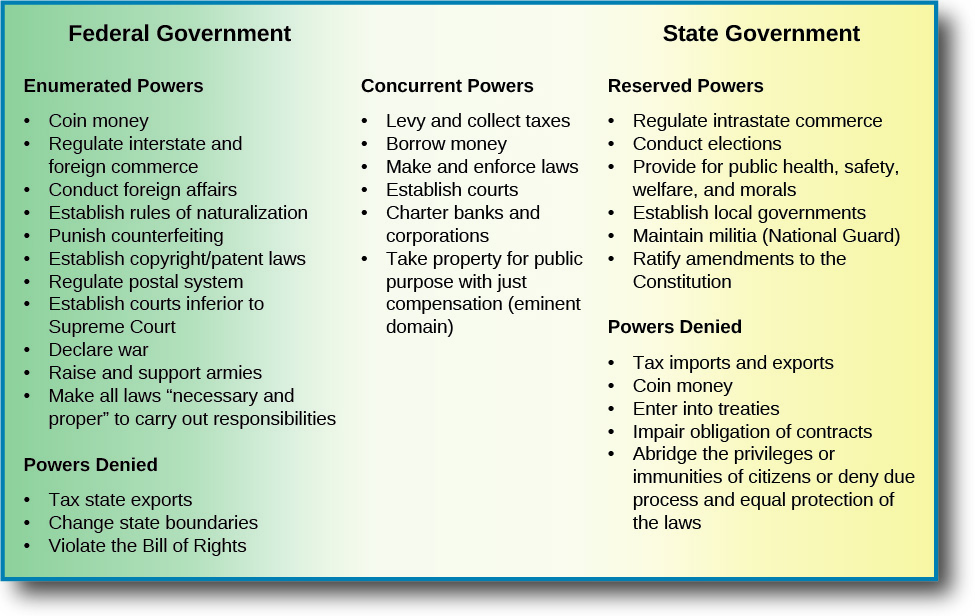
Figure 2. Constitutional powers and responsibilities are divided between the U.S. federal and state governments. The two levels of government also share concurrent powers.
Article I, Sections 9 and 10, along with several constitutional amendments, lay out the restrictions on federal and state authority. The most important restriction Section 9 places on the national government prevents measures that cause the deprivation of personal liberty. Specifically, the government cannot suspend the writ of habeas corpus, which enables someone in custody to petition a judge to determine whether that person’s detention is legal; pass a bill of attainder, a legislative action declaring someone guilty without a trial; or enact an ex post facto law, which criminalizes an act retroactively. The Bill of Rights affirms and expands these constitutional restrictions, ensuring that the government cannot encroach on personal freedoms.
The states are also constrained by the Constitution. Article I, Section 10, prohibits the states from entering into treaties with other countries, coining money, and levying taxes on imports and exports. Like the federal government, the states cannot violate personal freedoms by suspending the writ of habeas corpus, passing bills of attainder, or enacting ex post facto laws. Furthermore, the Fourteenth Amendment, ratified in 1868, prohibits the states from denying citizens the rights to which they are entitled by the Constitution, due process of law, or the equal protection of the laws. Lastly, three civil rights amendments—the Fifteenth, Nineteenth, and Twenty-Sixth—prevent both the states and the federal government from abridging citizens’ right to vote based on race, sex, and age. This topic remains controversial because states have not always ensured equal protection.
The supremacy clause in Article VI of the Constitution regulates relationships between the federal and state governments by declaring that the Constitution and federal law are the supreme law of the land. This means that if a state law clashes with a federal law found to be within the national government’s constitutional authority, the federal law prevails. The intent of the supremacy clause is not to subordinate the states to the federal government; rather, it affirms that one body of laws binds the country. In fact, all national and state government officials are bound by oath to uphold the Constitution regardless of the offices they hold. Yet enforcement is not always that simple. In the case of marijuana use, which the federal government defines to be illegal, twenty-three states and the District of Columbia have nevertheless established medical marijuana laws, others have decriminalized its recreational use, and four states have completely legalized it. The federal government could act in this area if it wanted to. For example, in addition to the legalization issue, there is the question of how to treat the money from marijuana sales, which the national government designates as drug money and regulates under laws regarding its deposit in banks.
Various constitutional provisions govern state-to-state relations. Article IV, Section 1, referred to as the full faith and credit clause or the comity clause, requires the states to accept court decisions, public acts, and contracts of other states. Thus, an adoption certificate or driver’s license issued in one state is valid in any other state. The movement for marriage equality has put the full faith and credit clause to the test in recent decades. In light of Baehr v. Lewin, a 1993 ruling in which the Hawaii Supreme Court asserted that the state’s ban on same-sex marriage was unconstitutional, a number of states became worried that they would be required to recognize those marriage certificates.[8]
To address this concern, Congress passed and President Clinton signed the Defense of Marriage Act (DOMA) in 1996. The law declared that “No state (or other political subdivision within the United States) need recognize a marriage between persons of the same sex, even if the marriage was concluded or recognized in another state.” The law also barred federal benefits for same-sex partners.
DOMA clearly made the topic a state matter. It denoted a choice for states, which led many states to take up the policy issue of marriage equality. Scores of states considered legislation and ballot initiatives on the question. The federal courts took up the issue with zeal after the U.S. Supreme Court in United States v. Windsor struck down the part of DOMA that outlawed federal benefits.[9]
That move was followed by upwards of forty federal court decisions that upheld marriage equality in particular states. In 2014, the Supreme Court decided not to hear several key case appeals from a variety of states, all of which were brought by opponents of marriage equality who had lost in the federal courts. The outcome of not hearing these cases was that federal court decisions in four states were affirmed, which, when added to other states in the same federal circuit districts, brought the total number of states permitting same-sex marriage to thirty.[10]
Then, in 2015, the Obergefell v. Hodges case had a sweeping effect when the Supreme Court clearly identified a constitutional right to marriage based on the Fourteenth Amendment.[11]
The privileges and immunities clause of Article IV asserts that states are prohibited from discriminating against out-of-staters by denying them such guarantees as access to courts, legal protection, property rights, and travel rights. The clause has not been interpreted to mean there cannot be any difference in the way a state treats residents and non-residents. For example, individuals cannot vote in a state in which they do not reside, tuition at state universities is higher for out-of-state residents, and in some cases individuals who have recently become residents of a state must wait a certain amount of time to be eligible for social welfare benefits. Another constitutional provision prohibits states from establishing trade restrictions on goods produced in other states. However, a state can tax out-of-state goods sold within its borders as long as state-made goods are taxed at the same level.
THE DISTRIBUTION OF FINANCES
Federal, state, and local governments depend on different sources of revenue to finance their annual expenditures. In 2014, total revenue (or receipts) reached $3.2 trillion for the federal government, $1.7 trillion for the states, and $1.2 trillion for local governments.[12]
Two important developments have fundamentally changed the allocation of revenue since the early 1900s. First, the ratification of the Sixteenth Amendment in 1913 authorized Congress to impose income taxes without apportioning it among the states on the basis of population, a burdensome provision that Article I, Section 9, had imposed on the national government.[13]
With this change, the federal government’s ability to raise revenue significantly increased and so did its ability to spend.
The second development regulates federal grants, that is, transfers of federal money to state and local governments. These transfers, which do not have to be repaid, are designed to support the activities of the recipient governments, but also to encourage them to pursue federal policy objectives they might not otherwise adopt. The expansion of the federal government’s spending power has enabled it to transfer more grant money to lower government levels, which has accounted for an increasing share of their total revenue.[14]
The sources of revenue for federal, state, and local governments are detailed in (Figure). Although the data reflect 2013 results, the patterns we see in the figure give us a good idea of how governments have funded their activities in recent years. For the federal government, 47 percent of 2013 revenue came from individual income taxes and 34 percent from payroll taxes, which combine Social Security tax and Medicare tax.
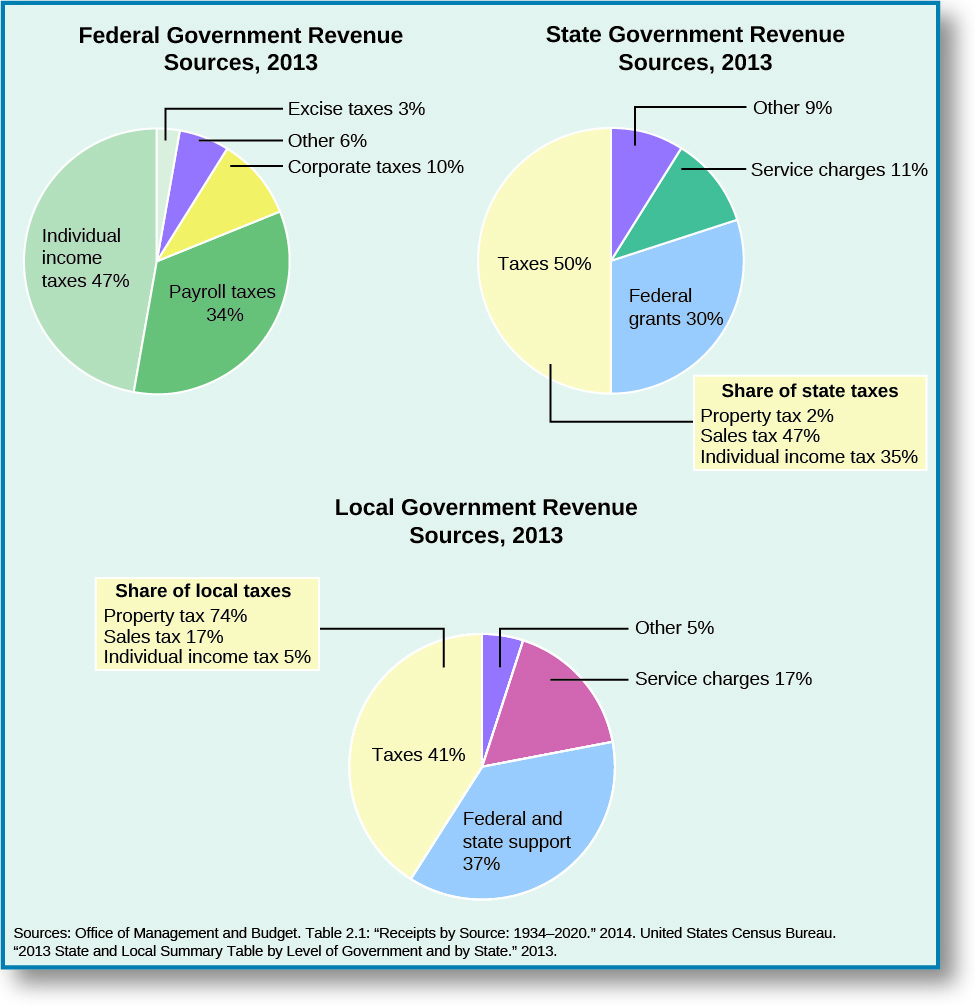
Figure 3. As these charts indicate, federal, state, and local governments raise revenue from different sources.
For state governments, 50 percent of revenue came from taxes, while 30 percent consisted of federal grants. Sales tax—which includes taxes on purchased food, clothing, alcohol, amusements, insurance, motor fuels, tobacco products, and public utilities, for example—accounted for about 47 percent of total tax revenue, and individual income taxes represented roughly 35 percent. Revenue from service charges (e.g., tuition revenue from public universities and fees for hospital-related services) accounted for 11 percent.
The tax structure of states varies. Alaska, Florida, Nevada, South Dakota, Texas, Washington, and Wyoming do not have individual income taxes. (Figure) illustrates yet another difference: Fuel tax as a percentage of total tax revenue is much higher in South Dakota and West Virginia than in Alaska and Hawaii. However, most states have done little to prevent the erosion of the fuel tax’s share of their total tax revenue between 2007 and 2014 (notice that for many states the dark blue dots for 2014 are to the left of the light blue numbers for 2007). Fuel tax revenue is typically used to finance state highway transportation projects, although some states do use it to fund non-transportation projects.
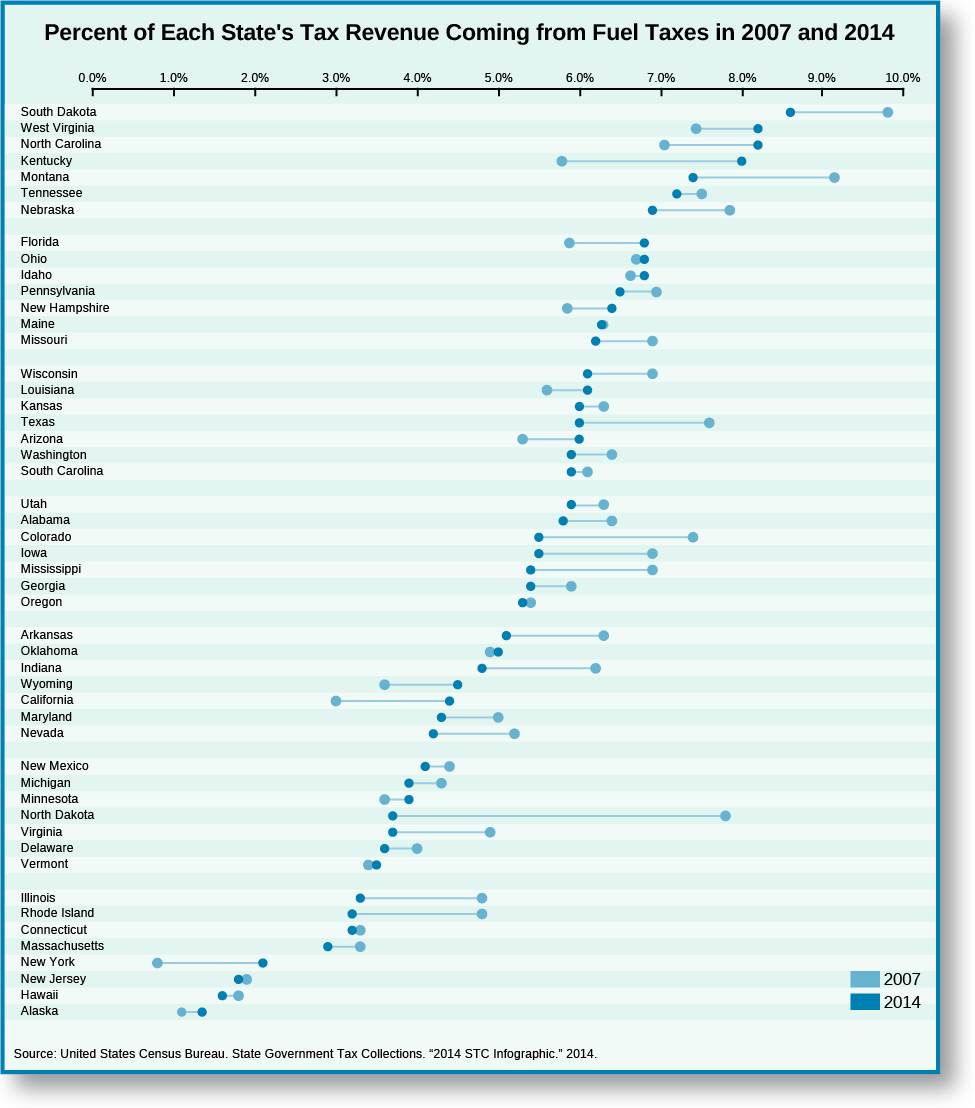
Figure 4. The fuel tax as a percentage of tax revenue varies greatly across states.
The most important sources of revenue for local governments in 2013 were taxes, federal and state grants, and service charges. For local governments the property tax, a levy on residential and commercial real estate, was the most important source of tax revenue, accounting for about 74 percent of the total. Federal and state grants accounted for 37 percent of local government revenue. State grants made up 87 percent of total local grants. Charges for hospital-related services, sewage and solid-waste management, public city university tuition, and airport services are important sources of general revenue for local governments.
Intergovernmental grants are important sources of revenue for both state and local governments. When economic times are good, such grants help states, cities, municipalities, and townships carry out their regular functions. However, during hard economic times, such as the Great Recession of 2007–2009, intergovernmental transfers provide much-needed fiscal relief as the revenue streams of state and local governments dry up. During the Great Recession, tax receipts dropped as business activities slowed, consumer spending dropped, and family incomes decreased due to layoffs or work-hour reductions. To offset the adverse effects of the recession on the states and local governments, federal grants increased by roughly 33 percent during this period.[15]
In 2009, President Obama signed the American Recovery and Reinvestment Act (ARRA), which provided immediate economic-crisis management assistance such as helping local and state economies ride out the Great Recession and shoring up the country’s banking sector. A total of $274.7 billion in grants, contracts, and loans was allocated to state and local governments under the ARRA.[16]
The bulk of the stimulus funds apportioned to state and local governments was used to create and protect existing jobs through public works projects and to fund various public welfare programs such as unemployment insurance.[17]
How are the revenues generated by our tax dollars, fees we pay to use public services and obtain licenses, and monies from other sources put to use by the different levels of government? A good starting point to gain insight on this question as it relates to the federal government is Article I, Section 8, of the Constitution. Recall, for instance, that the Constitution assigns the federal government various powers that allow it to affect the nation as a whole. A look at the federal budget in 2014 (Figure) shows that the three largest spending categories were Social Security (24 percent of the total budget); Medicare, Medicaid, the Children’s Health Insurance Program, and marketplace subsidies under the Affordable Care Act (24 percent); and defense and international security assistance (18 percent). The rest was divided among categories such as safety net programs (11 percent), including the Earned Income Tax Credit and Child Tax Credit, unemployment insurance, food stamps, and other low-income assistance programs; interest on federal debt (7 percent); benefits for federal retirees and veterans (8 percent); and transportation infrastructure (3 percent).[18]
It is clear from the 2014 federal budget that providing for the general welfare and national defense consumes much of the government’s resources—not just its revenue, but also its administrative capacity and labor power.
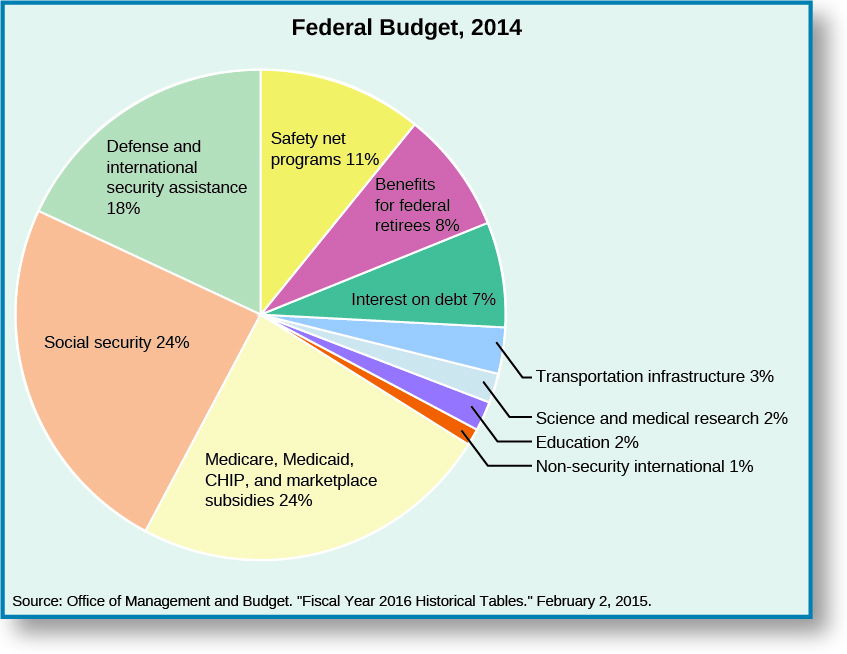
Figure 5. Approximately two-thirds of the federal budget is spent in just three categories: Social Security, health care and health insurance programs, and defense.
(Figure) compares recent spending activities of local and state governments. Educational expenditures constitute a major category for both. However, whereas the states spend comparatively more than local governments on university education, local governments spend even more on elementary and secondary education. That said, nationwide, state funding for public higher education has declined as a percentage of university revenues; this is primarily because states have taken in lower amounts of sales taxes as internet commerce has increased. Local governments allocate more funds to police protection, fire protection, housing and community development, and public utilities such as water, sewage, and electricity. And while state governments allocate comparatively more funds to public welfare programs, such as health care, income support, and highways, both local and state governments spend roughly similar amounts on judicial and legal services and correctional services.
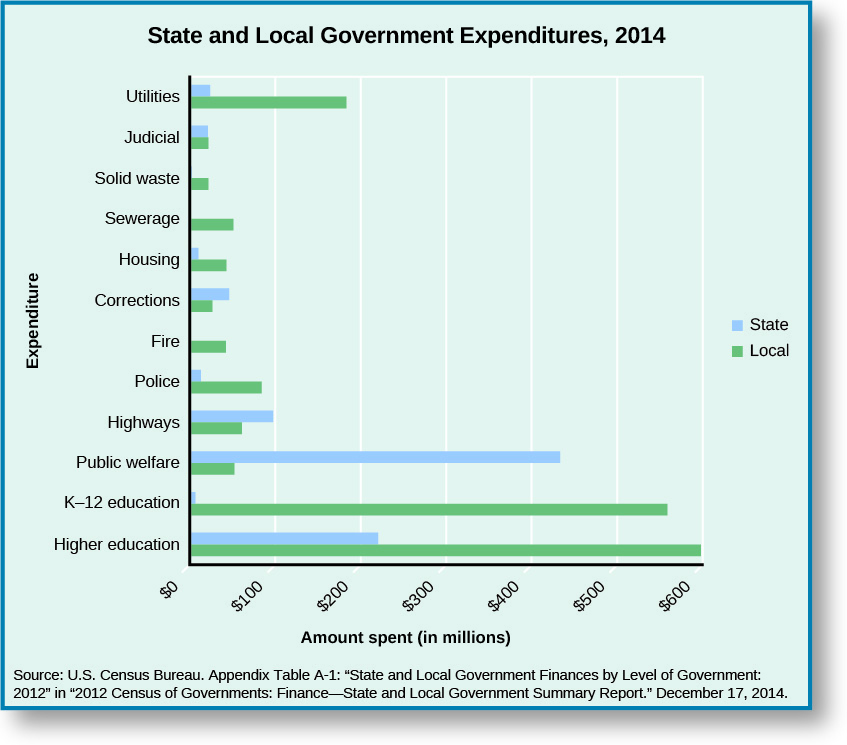
Figure 6. This list includes some of the largest expenditure items for state and local governments.
Summary
Federalism is a system of government that creates two relatively autonomous levels of government, each possessing authority granted to them by the national constitution. Federal systems like the one in the United States are different from unitary systems, which concentrate authority in the national government, and from confederations, which concentrate authority in subnational governments.
The U.S. Constitution allocates powers to the states and federal government, structures the relationship between these two levels of government, and guides state-to-state relationships. Federal, state, and local governments rely on different sources of revenue to enable them to fulfill their public responsibilities.
| NOTE: The activities below will not be counted towards your final grade for this class. They are strictly here to help you check your knowledge in preparation for class assignments and future dialogue. Best of luck! |
Glossary
- bill of attainder
- a legislative action declaring someone guilty without a trial; prohibited under the Constitution
- concurrent powers
- shared state and federal powers that range from taxing, borrowing, and making and enforcing laws to establishing court systems
- devolution
- a process in which powers from the central government in a unitary system are delegated to subnational units
- elastic clause
- the last clause of Article I, Section 8, which enables the national government “to make all Laws which shall be necessary and proper for carrying” out all its constitutional responsibilities
- ex post facto law
- a law that criminalizes an act retroactively; prohibited under the Constitution
- federalism
- an institutional arrangement that creates two relatively autonomous levels of government, each possessing the capacity to act directly on the people with authority granted by the national constitution
- full faith and credit clause
- found in Article IV, Section 1, of the Constitution, this clause requires states to accept court decisions, public acts, and contracts of other states; also referred to as the comity provision
- privileges and immunities clause
- found in Article IV, Section 2, of the Constitution, this clause prohibits states from discriminating against out-of-staters by denying such guarantees as access to courts, legal protection, and property and travel rights
- unitary system
- a centralized system of government in which the subnational government is dependent on the central government, where substantial authority is concentrated
- writ of habeas corpus
- a petition that enables someone in custody to petition a judge to determine whether that person’s detention is legal
- John Kincaid. 1975. “Federalism.” In Civitas: A Framework for Civil Education, eds. Charles Quigley and Charles Bahmueller. Calabasas, CA: Center for Civic Education, 391–392; William S. Riker. 1975. “Federalism.” In Handbook of Political Science, eds. Fred Greenstein and Nelson Polsby. Reading, MA: Addison-Wesley, 93–172. ↵
- Garry Willis, ed. 1982. The Federalist Papers by Alexander Hamilton, James Madison and John Jay. New York: Bantam Books, 237. ↵
- Arizona v. United States, 567 U.S. __ (2012). ↵
- United States v. Wrightwood Dairy Co., 315 U.S. 110 (1942). ↵
- Ronald L. Watts. 1999. Comparing Federal Systems, 2nd ed. Kingston, Ontario: McGill-Queen’s University, 6–7; Daniel J. Elazar. 1992. Federal Systems of the World: A Handbook of Federal, Confederal and Autonomy Arrangements. Harlow, Essex: Longman Current Affairs. ↵
- Jack Rakove. 2007. James Madison and the Creation of the American Republic. New York: Pearson; Samuel H. Beer. 1998. To Make a Nation: The Rediscovery of American Federalism. Cambridge, MA: Harvard University Press. ↵
- Elton E. Richter. 1929. “Exclusive and Concurrent Powers in the Federal Constitution,” Notre Dame Law Review 4, No. 8: 513–542. http://scholarship.law.nd.edu/cgi/viewcontent.cgi?article=4416&context=ndlr ↵
- Baehr v. Lewin. 1993. 74 Haw. 530. ↵
- United States v. Windsor, 570 U.S. __ (2013). ↵
- Adam Liptak, “Supreme Court Delivers Tacit Win to Gay Marriage,” New York Times, 6 October, 2014. ↵
- Obergefell v. Hodges, 576 U.S. ___ (2015). ↵
- http://www.usgovernmentrevenue.com/federal_revenue. State and local government figures are estimated. ↵
- Pollock v. Farmers’ Loan & Trust Co., 158 U.S. 601 (1895). ↵
- Robert Jay Dilger, “Federal Grants to State and Local Governments: A Historical Perspective on Contemporary Issues,” Congressional Research Service, Report 7-5700, 5 March 2015. ↵
- Jeffrey L. Barnett et al. 2014. 2012 Census of Governments: Finance-State and Local Government Summary Report, Appendix Table A-1. December 17. Washington, DC: United States Census Bureau, 2. ↵
- Dilger, “Federal Grants to State and Local Governments,” 4. ↵
- James Feyrer and Bruce Sacerdote. 2011. “Did the Stimulus Stimulate? Real Time Estimates of the Effects of the American Recovery and Reinvestment Act” (Working Paper No. 16759), Cambridge, MA: National Bureau of Economic Research. http://www.nber.org/papers/w16759.pdf ↵
- the Center on Budget and Policy Priorities. 2015. “Policy Basics: Where Do Our Federal Tax Dollars Go?” March 11. http://www.cbpp.org/research/policy-basics-where-do-our-federal-tax-dollars-go ↵
