
Chapter 11: Congress
Congressional Elections
Learning Objectives
By the end of this section, you will be able to:
- Explain how fundamental characteristics of the House and Senate shape their elections
- Discuss campaign funding and the effects of incumbency in the House and Senate
- Analyze the way congressional elections can sometimes become nationalized
The House and Senate operate very differently, partly because their members differ in the length of their terms, as well as in their age and other characteristics. In this section, we will explore why constitutional rules affect the elections for the two types of representatives and the reason the two bodies function differently by design. We also look at campaign finance to better understand how legislators get elected and stay elected.
UNDERSTANDING THE HOUSE AND SENATE
The U.S. Constitution is very clear about who can be elected as a member of the House or Senate. A House member must be a U.S. citizen of at least seven years’ standing and at least twenty-five years old. Senators are required to have nine years’ standing as citizens and be at least thirty years old when sworn in. Representatives serve two-year terms, whereas senators serve six-year terms. Per the Supreme Court decision in U.S. Term Limits v. Thornton (1995), there are currently no term limits for either senators or representatives, despite efforts by many states to impose them in the mid-1990s.[1]
House members are elected by the voters in their specific congressional districts. There are currently 435 congressional districts in the United States and thus 435 House members, and each state has a number of House districts roughly proportional to its share of the total U.S. population, with states guaranteed at least one House member. Two senators are elected by each state.
The structural and other differences between the House and Senate have practical consequences for the way the two chambers function. The House of Representatives has developed a stronger and more structured leadership than the Senate. Because its members serve short, two-year terms, they must regularly answer to the demands of their constituency when they run for election or reelection. Even House members of the same party in the same state will occasionally disagree on issues because of the different interests of their specific districts. Thus, the House can be highly partisan at times.
In contrast, members of the Senate are furthest from the demands and scrutiny of their constituents. Because of their longer six-year terms, they will see every member of the House face his or her constituents multiple times before they themselves are forced to seek reelection. Originally, when a state’s two U.S. senators were appointed by the state legislature, the Senate chamber’s distance from the electorate was even greater. Also, unlike members of the House who can seek the narrower interests of their district, senators must maintain a broader appeal in order to earn a majority of the votes across their entire state. In addition, the rules of the Senate allow individual members to slow down or stop legislation they dislike. These structural differences between the two chambers create real differences in the actions of their members. The heat of popular, sometimes fleeting, demands from constituents often glows red hot in the House. The Senate has the flexibility to allow these passions to cool. Dozens of major initiatives were passed by the House and had a willing president, for example, only to be defeated in the Senate. In 2012, the Buffett Rule would have implemented a minimum tax rate of 30 percent on wealthy Americans. Sixty senators had to agree to bring it to a vote, but the bill fell short of that number and died.[2]
Similarly, although the ACA became widely known as “Obamacare,” the president did not send a piece of legislation to Capitol Hill; he asked Congress to write the bills. Both the House and Senate authored their own versions of the legislation. The House’s version was much bolder and larger in terms of establishing a national health care system. However, it did not stand a chance in the Senate, where a more moderate version of the legislation was introduced. In the end, House leaders saw the Senate version as preferable to doing nothing and ultimately supported it.
CONGRESSIONAL CAMPAIGN FUNDING
Modern political campaigns in the United States are expensive, and they have been growing more so. For example, in 1986, the costs of running a successful House and Senate campaign were $776,687 and $6,625,932, respectively, in 2014 dollars. By 2014, those values had shot to $1,466,533 and $9,655,660 ((Figure)).[3]
Raising this amount of money takes quite a bit of time and effort. Indeed, a presentation for incoming Democratic representatives suggested a daily Washington schedule of five hours reaching out to donors, while only three or four were to be used for actual congressional work. As this advice reveals, raising money for reelection constitutes a large proportion of the work a congressperson does. This has caused many to wonder whether the amount of money in politics has truly become a corrupting influence. However, overall, the lion’s share of direct campaign contributions in congressional elections comes from individual donors, who are less influential than the political action committees (PACs) that contribute the remainder.[4]
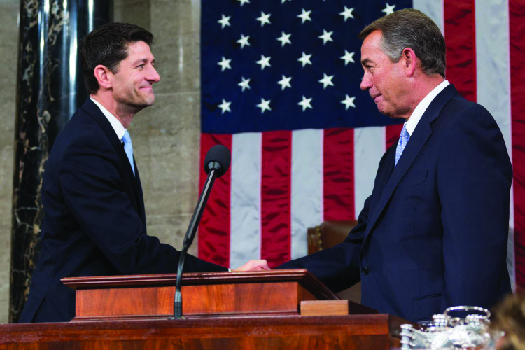
Figure 1. The most expensive House race in 2014 was that of Speaker of the House John Boehner (right), a Republican from Ohio, who spent over $17 million to hold his seat. He later resigned in 2015 and was replaced as Speaker by Paul Ryan (left) of Wisconsin’s 1st District.[5]
Nevertheless, the complex problem of funding campaigns has a long history in the United States. For nearly the first hundred years of the republic, there were no federal campaign finance laws. Then, between the late nineteenth century and the start of World War I, Congress pushed through a flurry of reforms intended to bring order to the world of campaign finance. These laws made it illegal for politicians to solicit contributions from civil service workers, made corporate contributions illegal, and required candidates to report their fundraising. As politicians and donors soon discovered, however, these laws were full of loopholes and were easily skirted by those who knew the ins and outs of the system.
Another handful of reform attempts were therefore pushed through in the wake of World War II, but then Congress neglected campaign finance reform for a few decades. That lull ended in the early 1970s when the Federal Election Campaign Act was passed. Among other things, it created the Federal Election Commission (FEC), required candidates to disclose where their money was coming from and where they were spending it, limited individual contributions, and provided for public financing of presidential campaigns.
Another important reform occurred in 2002, when Senators John McCain (R-AZ) and Russell Feingold (D-WI) drafted, and Congress passed, the Bipartisan Campaign Reform Act (BCRA), also referred to as the McCain-Feingold Act. The purpose of this law was to limit the use of “soft money,” which is raised for purposes like party-building efforts, get-out-the-vote efforts, and issue-advocacy ads. Unlike “hard money” contributed directly to a candidate, which is heavily regulated and limited, soft money had almost no regulations or limits. It had never been a problem before the mid-1990s, when a number of very imaginative political operatives developed a great many ways to spend this money. After that, soft-money donations skyrocketed. But the McCain-Feingold bill greatly limited this type of fundraising.
McCain-Feingold placed limits on total contributions to political parties, prohibited coordination between candidates and PAC campaigns, and required candidates to include personal endorsements on their political ads. Until 2010, it also limited advertisements run by unions and corporations thirty days before a primary and sixty days before a general election.[6]
The FEC’s enforcement of the law spurred numerous court cases challenging it. The most controversial decision was handed down by the Supreme Court in 2010, whose ruling on Citizens United v. Federal Election Commission led to the removal of spending limits on corporations. Justices in the majority argued that the BCRA violated a corporation’s free-speech rights.[7]
The Citizens United case began as a lawsuit against the FEC filed by Citizens United, a nonprofit organization that wanted to advertise a documentary critical of former senator and Democratic hopeful Hillary Clinton on the eve of the 2008 Democratic primaries. Advertising or showing the film during this time window was prohibited by the McCain-Feingold Act. But the Court found that this type of restriction violated the organization’s First Amendment right to free speech. As critics of the decision predicted at the time, the Court thus opened the floodgates to private soft money flowing into campaigns again.
In the wake of the Citizens United decision, a new type of advocacy group emerged, the super PAC. A traditional PAC is an organization designed to raise hard money to elect or defeat candidates. Such PACs tended to be run by businesses and other groups, like the Teamsters Union and the National Rifle Association, to support their special interests. They are highly regulated in regard to the amount of money they can take in and spend, but super PACs aren’t bound by these regulations. While they cannot give money directly to a candidate or a candidate’s party, they can raise and spend unlimited funds, and they can spend independently of a campaign or party. In the 2012 election cycle, for example, super PACs spent just over $600 million dollars and raised about $200 million more.[8]
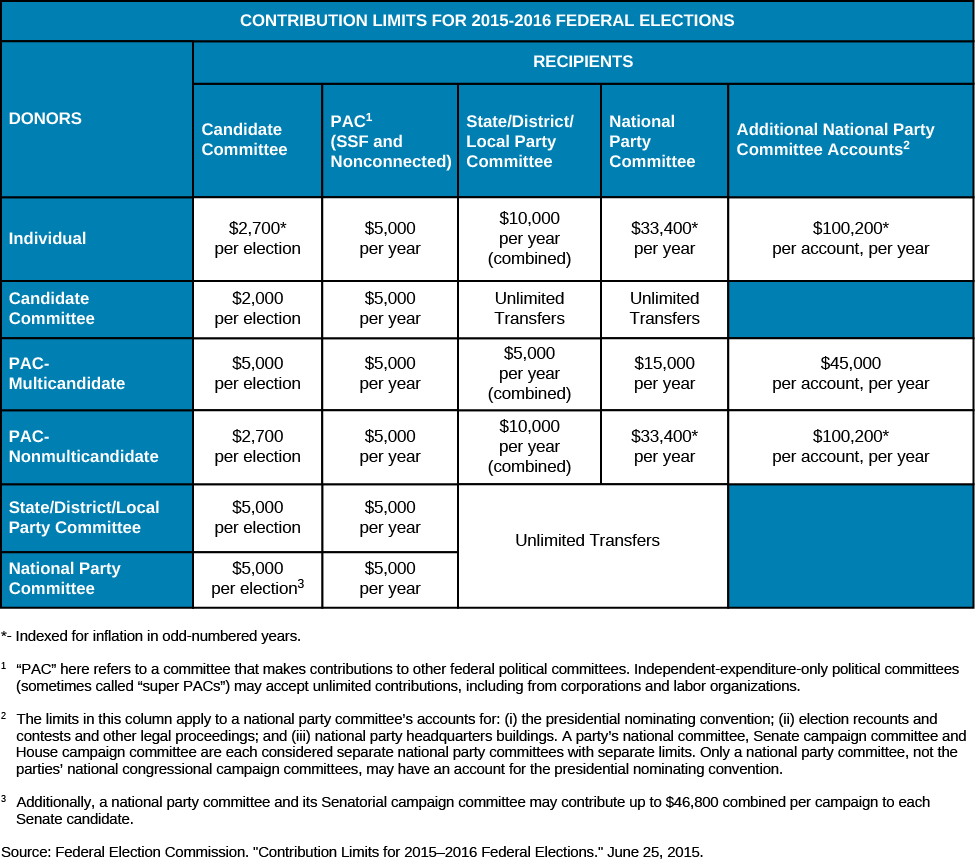
At the same time, several limits on campaign contributions have been upheld by the courts and remain in place. Individuals may contribute up to $2700 per candidate per election. Individuals may also give $5000 to PACs and $33,400 to a national party committee. PACs that contribute to more than one candidate are permitted to contribute $5000 per candidate per election, and up to $15,000 to a national party. PACs created to give money to only one candidate are limited to only $2700 per candidate, however ((Figure)).[9]
The amounts are adjusted every two years, based on inflation. These limits are intended to create a more equal playing field for the candidates, so that candidates must raise their campaign funds from a broad pool of contributors.
INCUMBENCY EFFECTS
Not surprisingly, the jungle of campaign financing regulations and loopholes is more easily navigated by incumbents in Congress than by newcomers. Incumbents are elected officials who currently hold an office. The amount of money they raise against their challengers demonstrates their advantage. In 2014, for example, the average Senate incumbent raised $12,144,933, whereas the average challenger raised only $1,223,566.[10]
This is one of the many reasons incumbents win a large majority of congressional races each electoral cycle. Incumbents attract more money because people want to give to a winner. In the House, the percentage of incumbents winning reelection has hovered between 85 and 100 percent for the last half century. In the Senate, there is only slightly more variation, given the statewide nature of the race, but it is still a very high majority of incumbents who win reelection ((Figure)). As these rates show, even in the worst political environments, incumbents are very difficult to defeat.
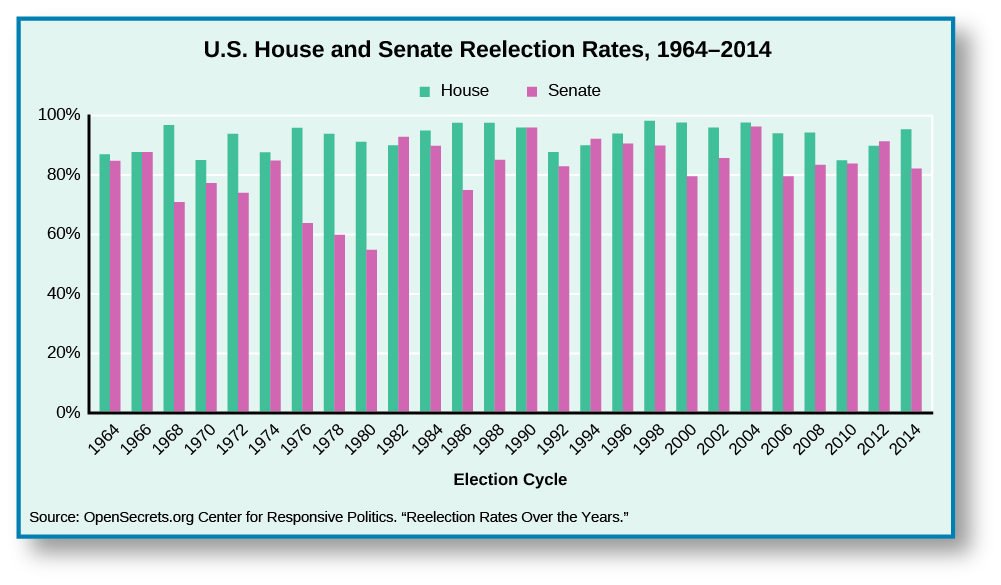
Figure 3. Historically, incumbents in both the House and the Senate enjoy high rates of reelection.
The historical difficulty of unseating an incumbent in the House or Senate is often referred to as the incumbent advantage or the incumbency effect. The advantage in financing is a huge part of this effect, but it is not the only important part. Incumbents often have a much higher level of name recognition. All things being equal, voters are far more likely to select the name of the person they recall seeing on television and hearing on the radio for the last few years than the name of a person they hardly know. And donors are more likely to want to give to a proven winner.
But more important is the way the party system itself privileges incumbents. A large percentage of congressional districts across the country are “safe seats” in uncompetitive districts, meaning candidates from a particular party are highly likely to consistently win the seat. This means the functional decision in these elections occurs during the primary, not in the general election. Political parties in general prefer to support incumbents in elections, because the general consensus is that incumbents are better candidates, and their record of success lends support to this conclusion. That said, while the political parties themselves to a degree control and regulate the primaries, popular individual candidates and challengers sometimes rule the day. This has especially been the case in recent years as conservative incumbents have been “primaried” by challengers more conservative than they.
|
The End of Incumbency Advantage? At the start of 2014, House majority whip Eric Cantor, a representative from Virginia, was at the top of his game. He was handsome, popular with talk show hosts and powerful insiders, an impressive campaign fundraiser and speaker, and apparently destined to become Speaker of the House when the current speaker stepped down. Four months later, Cantor lost the opportunity to run for his own congressional seat in a shocking primary election upset that shook the Washington political establishment to its core. What happened? How did such a powerful incumbent lose a game in which the cards had been stacked so heavily in his favor? Analyses of the stunning defeat quickly showed there were more chinks in Cantor’s polished armor than most wanted to admit. But his weakness wasn’t that he was unable to play the political game. Rather, he may have learned to play it too well. He became seen as too much of a Washington insider. Cantor’s ambition, political skill, deep connections to political insiders, and ability to come out squeaky clean after even the dirtiest political tussling should have given him a clear advantage over any competitor. But in the political environment of 2014, when conservative voices around the country criticized the party for ignoring the people and catering to political insiders, his strengths became weaknesses. Indeed, Cantor was the only highest-level Republican representative sacrificed to conservative populism. Were the winds of change blowing for incumbents? Between 1946 and 2012, only 5 percent of incumbent senators and 2 percent of House incumbents lost their party primaries.[11] In 2014, Cantor was one of four House incumbents who did so, while no incumbent senators suffered defeat. All evidence suggests the incumbent advantage, especially in the primary system, is alive and well. The story of Eric Cantor may very well be the classic case of an exception proving the rule. If you are a challenger running against an incumbent, what are some strategies you could use to make the race competitive? Would Congress operate differently if challengers defeated incumbents more often? |
Another reason incumbents wield a great advantage over their challengers is the state power they have at their disposal.[12]
One of the many responsibilities of a sitting congressperson is constituent casework. Constituents routinely reach out to their congressperson for powerful support to solve complex problems, such as applying for and tracking federal benefits or resolving immigration and citizenship challenges.[13]
Incumbent members of Congress have paid staff, influence, and access to specialized information that can help their constituents in ways other persons cannot. And congresspersons are hardly reticent about their efforts to support their constituents. Often, they will publicize their casework on their websites or, in some cases, create television advertisements that boast of their helpfulness. Election history has demonstrated that this form of publicity is very effective in garnering the support of voters.
LOCAL AND NATIONAL ELECTIONS
The importance of airing positive constituent casework during campaigns is a testament to the accuracy of saying, “All politics is local.” This phrase, attributed to former Speaker of the House Tip O’Neill (D-MA), essentially means that the most important motivations directing voters are rooted in local concerns. In general, this is true. People naturally feel more driven by the things that affect them on a daily basis. These are concerns like the quality of the roads, the availability of good jobs, and the cost and quality of public education. Good senators and representatives understand this and will seek to use their influence and power in office to affect these issues for the better. This is an age-old strategy for success in office and elections.
Political scientists have taken note of some voting patterns that appear to challenge this common assumption, however. In 1960, political scientist Angus Campbell proposed the surge-and-decline theory to explain these patterns.[14]
Campbell noticed that since the Civil War, with the exception of 1934, the president’s party has consistently lost seats in Congress during the midterm elections. He proposed that the reason was a surge in political stimulation during presidential elections, which contributes to greater turnout and brings in voters who are ordinarily less interested in politics. These voters, Campbell argued, tend to favor the party holding the presidency. In contrast, midterm elections witness the opposite effect. They are less stimulating and have lower turnout because less-interested voters stay home. This shift, in Campbell’s theory, provides an advantage to the party not currently occupying the presidency.
In the decades since Campbell’s influential theory was published, a number of studies have challenged his conclusions. Nevertheless, the pattern of midterm elections benefiting the president’s opposition has persisted.[15]
Only in exceptional years has this pattern been broken: first in 1998 during President Bill Clinton’s second term and the Monica Lewinsky scandal, when exit polls indicated most voters opposed the idea of impeaching the president, and then again in 2002, following the 9/11 terrorist attacks and the ensuing declaration of a “war on terror.”
The evidence does suggest that national concerns, rather than local ones, can function as powerful motivators at the polls. Consider, for example, the role of the Iraq War in bringing about a Democratic rout of the Republicans in the House in 2006 and in the Senate in 2008. Unlike previous wars in Europe and Vietnam, the war in Iraq was fought by a very small percentage of the population.[16]
The vast majority of citizens were not soldiers, few had relatives fighting in the war, and most did not know anyone who directly suffered from the prolonged conflict. Voters in large numbers were motivated by the political and economic disaster of the war to vote for politicians they believed would end it ((Figure)).
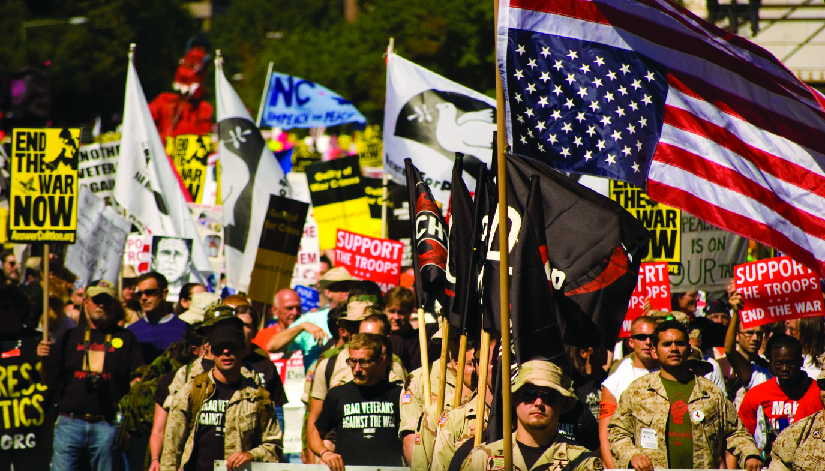
Figure 4. Wars typically have the power to nationalize local elections. What makes the Iraq War different is that the overwhelming majority of voters had little to no intimate connection with the conflict and were motivated to vote for those who would end it. (credit: “Lipton sale”/Wikimedia Commons)
Congressional elections may be increasingly driven by national issues. Just two decades ago, straight-ticket, party-line voting was still relatively rare across most of the country.[17]
In much of the South, which began to vote overwhelmingly Republican in presidential elections during the 1960s and 1970s, Democrats were still commonly elected to the House and Senate. The candidates themselves and the important local issues, apart from party affiliation, were important drivers in congressional elections. This began to change in the 1980s and 1990s, as Democratic representatives across the region began to dwindle. And the South isn’t alone; areas in the Northeast and the Northwest have grown increasingly Democratic. Indeed, the 2014 midterm election was the most nationalized election in many decades. Voters who favor a particular party in a presidential election are now much more likely to also support that same party in House and Senate elections than was the case just a few decades ago.
Summary
Since the House is closest to its constituents because reelection is so frequent a need, it tends to be more easily led by fleeting public desires. In contrast, the Senate’s distance from its constituents allows it to act more deliberately. Each type of representative, however, must raise considerable sums of money in order to stay in office. Attempts by Congress to rein in campaign spending have largely failed. Nevertheless, incumbents tend to have the easiest time funding campaigns and retaining their seats. They also benefit from the way parties organize primary elections, which are designed to promote incumbency.
| NOTE: The activities below will not be counted towards your final grade for this class. They are strictly here to help you check your knowledge in preparation for class assignments and future dialogue. Best of luck! |
Glossary
- surge-and-decline theory
- a theory proposing that the surge of stimulation occurring during presidential elections subsides during midterm elections, accounting for the differences we observe in turnouts and results
- U.S. Term Limits, Inc. v. Thornton, 514 U.S. 779 (1995). ↵
- http://dailysignal.com/2015/11/11/12-bills-that-the-filibuster-stopped-from-becoming-law/ (May 15, 2016). ↵
- “The Cost of Winning a House and Senate Seat, 1986–2014,” http://www.cfinst.org/pdf/vital/VitalStats_t1.pdf (May 15, 2016). ↵
- http://www.opensecrets.org/overview/wherefrom.php (May 15, 2016). ↵
- https://www.opensecrets.org/races/summary.php?id=OH08&cycle=2014 (May 15, 2016). ↵
- “Bipartisan Campaign Reform Act of 2002,” http://www.fec.gov/pages/bcra/bcra_update.shtml (May 15, 2016); Greg Scott and Gary Mullen, “Thirty Year Report,” September 2005, http://www.fec.gov/info/publications/30year.pdf (May 15, 2016). ↵
- Citizens United v. Federal Election Commission, 558 U.S. 310 (2010). ↵
- “2012 Outside Spending, by Super PAC,” https://www.opensecrets.org/outsidespending/summ.php?cycle=2012&chrt=V&type=S (May 15, 2016). ↵
- “Contribution Limits for the 2015-2016 Federal Elections,” http://www.fec.gov/info/contriblimitschart1516.pdf (May 15, 2016). ↵
- “Incumbent Advantage,” http://www.opensecrets.org/overview/incumbs.php?cycle=2014 (May 15, 2016). ↵
- Larry J. Sabato, Kyle Kondik, and Geoffrey Skelley, “Long Odds for Most Senate Primary Challenges,” 30 January 2014, http://www.centerforpolitics.org/crystalball/articles/long-odds-for-most-senate-primary-challenges/ (May 1, 2016). ↵
- David R. Mayhew. 1974. Congress: The Electoral Connection. New Haven, CT: Yale University Press. ↵
- R. Eric Petersen, “Casework in a Congressional Office: Background, Rules, Laws, and Resources,” 24 November 2014, https://www.fas.org/sgp/crs/misc/RL33209.pdf (May 1, 2016). ↵
- Angus Campbell. 1960. “Surge and Decline: A Study of Electoral Change.” The Public Opinion Quarterly 24, No. 3: 397–418. ↵
- “Midterm congressional elections explained: Why the president’s party typically loses,” 1 October 2014, http://journalistsresource.org/studies/politics/elections/voting-patterns-midterm-congressional-elections-why-presidents-party-typically-loses (May 1, 2016). ↵
- “A Profile of the Modern Military,” 5 October 2011, http://www.pewsocialtrends.org/2011/10/05/chapter-6-a-profile-of-the-modern-military/ (May 1, 2016). ↵
- Dhrumil Mehta and Harry Enten, “The 2014 Senate Elections Were the Most Nationalized In Decades,” 2 December 2014, http://fivethirtyeight.com/datalab/the-2014-senate-elections-were-the-most-nationalized-in-decades/ (May 1, 2016); Gregory Giroux, “Straight-Ticket Voting Rises As Parties Polarize,” Bloomberg, 29 November 2014, http://www.bloomberg.com/politics/articles/2014-11-29/straightticket-voting-rises-as-parties-polarize (May 1, 2016). ↵
