
Chapter 6: The Politics of Public Opinion
How Is Public Opinion Measured?
Learning Objectives
By the end of this section, you will be able to:
- Explain how information about public opinion is gathered
- Identify common ways to measure and quantify public opinion
- Analyze polls to determine whether they accurately measure a population’s opinions
Polling has changed over the years. The first opinion poll was taken in 1824; it asked voters how they voted as they left their polling places. Informal polls are called straw polls, and they informally collect opinions of a non-random population or group. Newspapers and social media continue the tradition of unofficial polls, mainly because interested readers want to know how elections will end. Facebook and online newspapers often offer informal, pop-up quizzes that ask a single question about politics or an event. The poll is not meant to be formal, but it provides a general idea of what the readership thinks.
Modern public opinion polling is relatively new, only eighty years old. These polls are far more sophisticated than straw polls and are carefully designed to probe what we think, want, and value. The information they gather may be relayed to politicians or newspapers, and is analyzed by statisticians and social scientists. As the media and politicians pay more attention to the polls, an increasing number are put in the field every week.
TAKING A POLL
Most public opinion polls aim to be accurate, but this is not an easy task. Political polling is a science. From design to implementation, polls are complex and require careful planning and care. Mitt Romney’s campaign polls are only a recent example of problems stemming from polling methods. Our history is littered with examples of polling companies producing results that incorrectly predicted public opinion due to poor survey design or bad polling methods.
In 1936, Literary Digest continued its tradition of polling citizens to determine who would win the presidential election. The magazine sent opinion cards to people who had a subscription, a phone, or a car registration. Only some of the recipients sent back their cards. The result? Alf Landon was predicted to win 55.4 percent of the popular vote; in the end, he received only 38 percent.[1]
Franklin D. Roosevelt won another term, but the story demonstrates the need to be scientific in conducting polls.
A few years later, Thomas Dewey lost the 1948 presidential election to Harry Truman, despite polls showing Dewey far ahead and Truman destined to lose ((Figure)). More recently, John Zogby, of Zogby Analytics, went public with his prediction that John Kerry would win the presidency against incumbent president George W. Bush in 2004, only to be proven wrong on election night. These are just a few cases, but each offers a different lesson. In 1948, pollsters did not poll up to the day of the election, relying on old numbers that did not include a late shift in voter opinion. Zogby’s polls did not represent likely voters and incorrectly predicted who would vote and for whom. These examples reinforce the need to use scientific methods when conducting polls, and to be cautious when reporting the results.
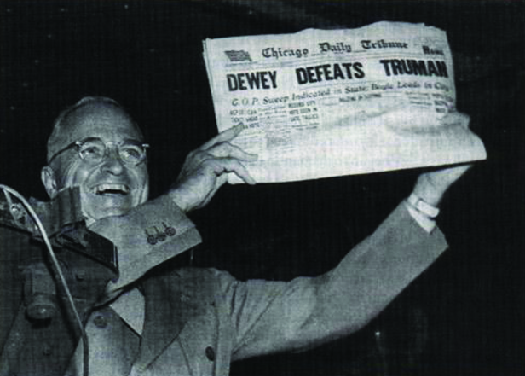
Figure 1. Polling process errors can lead to incorrect predictions. On November 3, the day after the 1948 presidential election, a jubilant Harry S. Truman triumphantly displays the inaccurate headline of the Chicago Daily Tribune announcing Thomas Dewey’s supposed victory (credit: David Erickson/Flickr).
Most polling companies employ statisticians and methodologists trained in conducting polls and analyzing data. A number of criteria must be met if a poll is to be completed scientifically. First, the methodologists identify the desired population, or group, of respondents they want to interview. For example, if the goal is to project who will win the presidency, citizens from across the United States should be interviewed. If we wish to understand how voters in Colorado will vote on a proposition, the population of respondents should only be Colorado residents. When surveying on elections or policy matters, many polling houses will interview only respondents who have a history of voting in previous elections, because these voters are more likely to go to the polls on Election Day. Politicians are more likely to be influenced by the opinions of proven voters than of everyday citizens. Once the desired population has been identified, the researchers will begin to build a sample that is both random and representative.
A random sample consists of a limited number of people from the overall population, selected in such a way that each has an equal chance of being chosen. In the early years of polling, telephone numbers of potential respondents were arbitrarily selected from various areas to avoid regional bias. While landline phones allow polls to try to ensure randomness, the increasing use of cell phones makes this process difficult. Cell phones, and their numbers, are portable and move with the owner. To prevent errors, polls that include known cellular numbers may screen for zip codes and other geographic indicators to prevent regional bias. A representative sample consists of a group whose demographic distribution is similar to that of the overall population. For example, nearly 51 percent of the U.S. population is female.[2]
To match this demographic distribution of women, any poll intended to measure what most Americans think about an issue should survey a sample containing slightly more women than men.
Pollsters try to interview a set number of citizens to create a reasonable sample of the population. This sample size will vary based on the size of the population being interviewed and the level of accuracy the pollster wishes to reach. If the poll is trying to reveal the opinion of a state or group, such as the opinion of Wisconsin voters about changes to the education system, the sample size may vary from five hundred to one thousand respondents and produce results with relatively low error. For a poll to predict what Americans think nationally, such as about the White House’s policy on greenhouse gases, the sample size should be larger.
The sample size varies with each organization and institution due to the way the data are processed. Gallup often interviews only five hundred respondents, while Rasmussen Reports and Pew Research often interview one thousand to fifteen hundred respondents.[3]
Academic organizations, like the American National Election Studies, have interviews with over twenty-five-hundred respondents.[4]
A larger sample makes a poll more accurate, because it will have relatively fewer unusual responses and be more representative of the actual population. Pollsters do not interview more respondents than necessary, however. Increasing the number of respondents will increase the accuracy of the poll, but once the poll has enough respondents to be representative, increases in accuracy become minor and are not cost-effective.[5]
When the sample represents the actual population, the poll’s accuracy will be reflected in a lower margin of error. The margin of error is a number that states how far the poll results may be from the actual opinion of the total population of citizens. The lower the margin of error, the more predictive the poll. Large margins of error are problematic. For example, if a poll that claims Hillary Clinton is likely to win 30 percent of the vote in the 2016 New York Democratic primary has a margin of error of +/-6, it tells us that Clinton may receive as little as 24 percent of the vote (30 – 6) or as much as 36 percent (30 + 6). A lower of margin of error is clearly desirable because it gives us the most precise picture of what people actually think or will do.
With many polls out there, how do you know whether a poll is a good poll and accurately predicts what a group believes? First, look for the numbers. Polling companies include the margin of error, polling dates, number of respondents, and population sampled to show their scientific reliability. Was the poll recently taken? Is the question clear and unbiased? Was the number of respondents high enough to predict the population? Is the margin of error small? It is worth looking for this valuable information when you interpret poll results. While most polling agencies strive to create quality polls, other organizations want fast results and may prioritize immediate numbers over random and representative samples. For example, instant polling is often used by news networks to quickly assess how well candidates are performing in a debate.
|
The Ins and Outs of Polls Ever wonder what happens behind the polls? To find out, we posed a few questions to Scott Keeter, Director of Survey Research at Pew Research Center. Q: What are some of the most common misconceptions about polling? A: A couple of them recur frequently. The first is that it is just impossible for one thousand or fifteen hundred people in a survey sample to adequately represent a population of 250 million adults. But of course it is possible. Random sampling, which has been well understood for the past several decades, makes it possible. If you don’t trust small random samples, then ask your doctor to take all of your blood the next time you need a diagnostic test. The second misconception is that it is possible to get any result we want from a poll if we are willing to manipulate the wording sufficiently. While it is true that question wording can influence responses, it is not true that a poll can get any result it sets out to get. People aren’t stupid. They can tell if a question is highly biased and they won’t react well to it. Perhaps more important, the public can read the questions and know whether they are being loaded with words and phrases intended to push a respondent in a particular direction. That’s why it’s important to always look at the wording and the sequencing of questions in any poll. Q: How does your organization choose polling topics? A: We choose our topics in several ways. Most importantly, we keep up with developments in politics and public policy, and try to make our polls reflect relevant issues. Much of our research is driven by the news cycle and topics that we see arising in the near future. We also have a number of projects that we do regularly to provide a look at long-term trends in public opinion. For example, we’ve been asking a series of questions about political values since 1987, which has helped to document the rise of political polarization in the public. Another is a large (thirty-five thousand interviews) study of religious beliefs, behaviors, and affiliations among Americans. We released the first of these in 2007, and a second in 2015. Finally, we try to seize opportunities to make larger contributions on weighty issues when they arise. When the United States was on the verge of a big debate on immigration reform in 2006, we undertook a major survey of Americans’ attitudes about immigration and immigrants. In 2007, we conducted the first-ever nationally representative survey of Muslim Americans. Q: What is the average number of polls you oversee in a week? A: It depends a lot on the news cycle and the needs of our research groups. We almost always have a survey in progress, but sometimes there are two or three going on at once. At other times, we are more focused on analyzing data already collected or planning for future surveys. Q: Have you placed a poll in the field and had results that really surprised you? A: It’s rare to be surprised because we’ve learned a lot over the years about how people respond to questions. But here are some findings that jumped out to some of us in the past: 1) In 2012, we conducted a survey of people who said their religion is “nothing in particular.” We asked them if they are “looking for a religion that would be right” for them, based on the expectation that many people without an affiliation—but who had not said they were atheists or agnostic—might be trying to find a religion that fit. Only 10 percent said that they were looking for the right religion. 2) We—and many others—were surprised that public opinion about Muslims became more favorable after the 9/11 terrorist attacks. It’s possible that President Bush’s strong appeal to people not to blame Muslims in general for the attack had an effect on opinions. 3) It’s also surprising that basic public attitudes about gun control (whether pro or anti) barely move after highly publicized mass shootings. Were you surprised by the results Scott Keeter reported in response to the interviewer’s final question? Why or why not? Conduct some research online to discover what degree plans or work experience would help a student find a job in a polling organization. |
TECHNOLOGY AND POLLING
The days of randomly walking neighborhoods and phone book cold-calling to interview random citizens are gone. Scientific polling has made interviewing more deliberate. Historically, many polls were conducted in person, yet this was expensive and yielded problematic results.
In some situations and countries, face-to-face interviewing still exists. Exit polls, focus groups, and some public opinion polls occur in which the interviewer and respondents communicate in person ((Figure)). Exit polls are conducted in person, with an interviewer standing near a polling location and requesting information as voters leave the polls. Focus groups often select random respondents from local shopping places or pre-select respondents from Internet or phone surveys. The respondents show up to observe or discuss topics and are then surveyed.
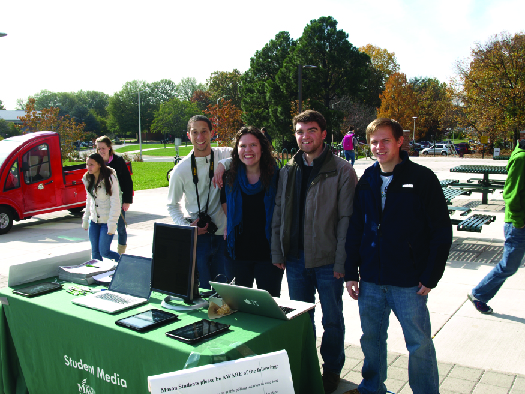
Figure 2. On November 6, 2012, the Connect2Mason.com team conducts exit surveys at the polls on the George Mason University campus. (credit: Mason Votes/Flickr).
When organizations like Gallup or Roper decide to conduct face-to-face public opinion polls, however, it is a time-consuming and expensive process. The organization must randomly select households or polling locations within neighborhoods, making sure there is a representative household or location in each neighborhood.[6]
Then it must survey a representative number of neighborhoods from within a city. At a polling location, interviewers may have directions on how to randomly select voters of varied demographics. If the interviewer is looking to interview a person in a home, multiple attempts are made to reach a respondent if he or she does not answer. Gallup conducts face-to-face interviews in areas where less than 80 percent of the households in an area have phones, because it gives a more representative sample.[7]
News networks use face-to-face techniques to conduct exit polls on Election Day.
Most polling now occurs over the phone or through the Internet. Some companies, like Harris Interactive, maintain directories that include registered voters, consumers, or previously interviewed respondents. If pollsters need to interview a particular population, such as political party members or retirees of a specific pension fund, the company may purchase or access a list of phone numbers for that group. Other organizations, like Gallup, use random-digit-dialing (RDD), in which a computer randomly generates phone numbers with desired area codes. Using RDD allows the pollsters to include respondents who may have unlisted and cellular numbers.[8]
Questions about ZIP code or demographics may be asked early in the poll to allow the pollsters to determine which interviews to continue and which to end early.
The interviewing process is also partly computerized. Many polls are now administered through computer-assisted telephone interviewing (CATI) or through robo-polls. A CATI system calls random telephone numbers until it reaches a live person and then connects the potential respondent with a trained interviewer. As the respondent provides answers, the interviewer enters them directly into the computer program. These polls may have some errors if the interviewer enters an incorrect answer. The polls may also have reliability issues if the interviewer goes off the script or answers respondents’ questions.
Robo-polls are entirely computerized. A computer dials random or pre-programmed numbers and a prerecorded electronic voice administers the survey. The respondent listens to the question and possible answers and then presses numbers on the phone to enter responses. Proponents argue that respondents are more honest without an interviewer. However, these polls can suffer from error if the respondent does not use the correct keypad number to answer a question or misunderstands the question. Robo-polls may also have lower response rates, because there is no live person to persuade the respondent to answer. There is also no way to prevent children from answering the survey. Lastly, the Telephone Consumer Protection Act (1991) made automated calls to cell phones illegal, which leaves a large population of potential respondents inaccessible to robo-polls.[9]
The latest challenges in telephone polling come from the shift in phone usage. A growing number of citizens, especially younger citizens, use only cell phones, and their phone numbers are no longer based on geographic areas. The millennial generation (currently aged 18–33) is also more likely to text than to answer an unknown call, so it is harder to interview this demographic group. Polling companies now must reach out to potential respondents using email and social media to ensure they have a representative group of respondents.
Yet, the technology required to move to the Internet and handheld devices presents further problems. Web surveys must be designed to run on a varied number of browsers and handheld devices. Online polls cannot detect whether a person with multiple email accounts or social media profiles answers the same poll multiple times, nor can they tell when a respondent misrepresents demographics in the poll or on a social media profile used in a poll. These factors also make it more difficult to calculate response rates or achieve a representative sample. Yet, many companies are working with these difficulties, because it is necessary to reach younger demographics in order to provide accurate data.[10]
PROBLEMS IN POLLING
For a number of reasons, polls may not produce accurate results. Two important factors a polling company faces are timing and human nature. Unless you conduct an exit poll during an election and interviewers stand at the polling places on Election Day to ask voters how they voted, there is always the possibility the poll results will be wrong. The simplest reason is that if there is time between the poll and Election Day, a citizen might change his or her mind, lie, or choose not to vote at all. Timing is very important during elections, because surprise events can shift enough opinions to change an election result. Of course, there are many other reasons why polls, even those not time-bound by elections or events, may be inaccurate.
Created in 2003 to survey the American public on all topics, Rasmussen Reports is a new entry in the polling business. Rasmussen also conducts exit polls for each national election.
Polls begin with a list of carefully written questions. The questions need to be free of framing, meaning they should not be worded to lead respondents to a particular answer. For example, take two questions about presidential approval. Question 1 might ask, “Given the high unemployment rate, do you approve of the job President Obama is doing?” Question 2 might ask, “Do you approve of the job President Obama is doing?” Both questions want to know how respondents perceive the president’s success, but the first question sets up a frame for the respondent to believe the economy is doing poorly before answering. This is likely to make the respondent’s answer more negative. Similarly, the way we refer to an issue or concept can affect the way listeners perceive it. The phrase “estate tax” did not rally voters to protest the inheritance tax, but the phrase “death tax” sparked debate about whether taxing estates imposed a double tax on income.[11]
Many polling companies try to avoid leading questions, which lead respondents to select a predetermined answer, because they want to know what people really think. Some polls, however, have a different goal. Their questions are written to guarantee a specific outcome, perhaps to help a candidate get press coverage or gain momentum. These are called push polls. In the 2016 presidential primary race, MoveOn tried to encourage Senator Elizabeth Warren (D-MA) to enter the race for the Democratic nomination ((Figure)). Its poll used leading questions for what it termed an “informed ballot,” and, to show that Warren would do better than Hillary Clinton, it included ten positive statements about Warren before asking whether the respondent would vote for Clinton or Warren.[12]
The poll results were blasted by some in the media for being fake.
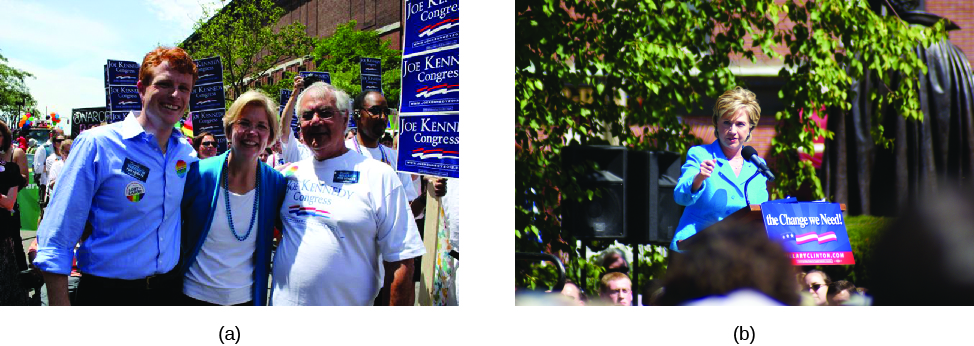
Figure 3. Senator Elizabeth Warren (a) poses with Massachusetts representatives Joseph P. Kennedy III (left) and Barney Frank (right) at the 2012 Boston Pride Parade. Senator Hillary Clinton (b) during her 2008 presidential campaign in Concord, New Hampshire (credit a: modification of work by “ElizabethForMA”/Flickr; credit b: modification of work by Marc Nozell)
Sometimes lack of knowledge affects the results of a poll. Respondents may not know that much about the polling topic but are unwilling to say, “I don’t know.” For this reason, surveys may contain a quiz with questions that determine whether the respondent knows enough about the situation to answer survey questions accurately. A poll to discover whether citizens support changes to the Affordable Care Act or Medicaid might first ask who these programs serve and how they are funded. Polls about territory seizure by the Islamic State (or ISIS) or Russia’s aid to rebels in Ukraine may include a set of questions to determine whether the respondent reads or hears any international news. Respondents who cannot answer correctly may be excluded from the poll, or their answers may be separated from the others.
People may also feel social pressure to answer questions in accordance with the norms of their area or peers.[13]
If they are embarrassed to admit how they would vote, they may lie to the interviewer. In the 1982 governor’s race in California, Tom Bradley was far ahead in the polls, yet on Election Day he lost. This result was nicknamed the Bradley effect, on the theory that voters who answered the poll were afraid to admit they would not vote for a black man because it would appear politically incorrect and racist. In the 2016 presidential election, the level of support for Republican nominee Donald Trump may have been artificially low in the polls due to the fact that some respondents did not want to admit they were voting for Trump.
In 2010, Proposition 19, which would have legalized and taxed marijuana in California, met with a new version of the Bradley effect. Nate Silver, a political blogger, noticed that polls on the marijuana proposition were inconsistent, sometimes showing the proposition would pass and other times showing it would fail. Silver compared the polls and the way they were administered, because some polling companies used an interviewer and some used robo-calling. He then proposed that voters speaking with a live interviewer gave the socially acceptable answer that they would vote against Proposition 19, while voters interviewed by a computer felt free to be honest ((Figure)).[14]
While this theory has not been proven, it is consistent with other findings that interviewer demographics can affect respondents’ answers. African Americans, for example, may give different responses to interviewers who are white than to interviewers who are black.[15]
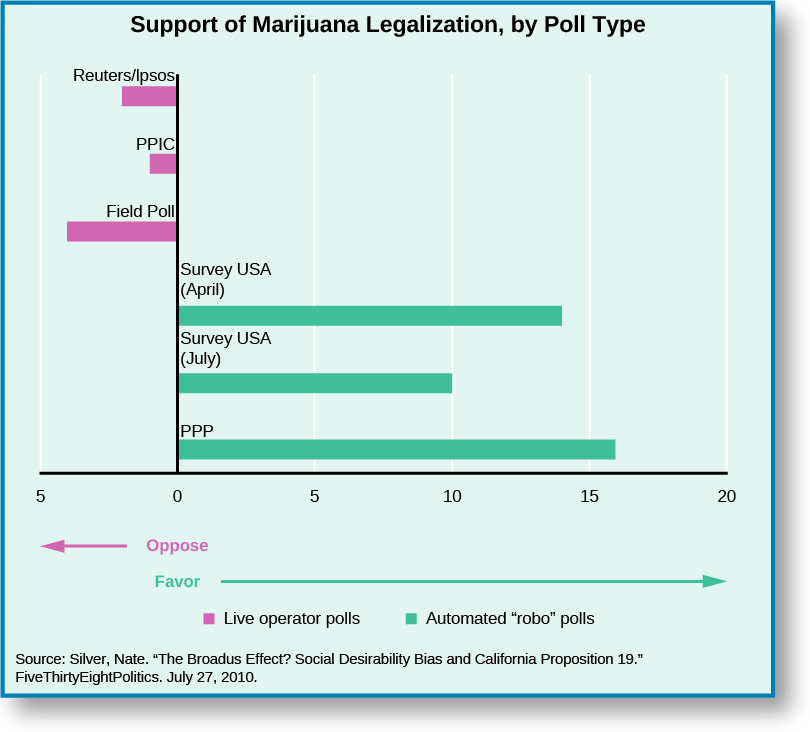
Figure 4. In 2010, polls about California’s Proposition 19 were inconsistent, depending on how they were administered, with voters who spoke with a live interviewer declaring they would vote against Proposition 19 and voters who were interviewed via a computer declaring support for the legislation. The measure was defeated on Election Day.
PUSH POLLS
One of the newer byproducts of polling is the creation of push polls, which consist of political campaign information presented as polls. A respondent is called and asked a series of questions about his or her position or candidate selections. If the respondent’s answers are for the wrong candidate, the next questions will give negative information about the candidate in an effort to change the voter’s mind.
In 2014, a fracking ban was placed on the ballot in a town in Texas. Fracking, which includes injecting pressurized water into drilled wells, helps energy companies collect additional gas from the earth. It is controversial, with opponents arguing it causes water pollution, sound pollution, and earthquakes. During the campaign, a number of local voters received a call that polled them on how they planned to vote on the proposed fracking ban.[16]
If the respondent was unsure about or planned to vote for the ban, the questions shifted to provide negative information about the organizations proposing the ban. One question asked, “If you knew the following, would it change your vote . . . two Texas railroad commissioners, the state agency that oversees oil and gas in Texas, have raised concerns about Russia’s involvement in the anti-fracking efforts in the U.S.?” The question played upon voter fears about Russia and international instability in order to convince them to vote against the fracking ban.
These techniques are not limited to issue votes; candidates have used them to attack their opponents. The hope is that voters will think the poll is legitimate and believe the negative information provided by a “neutral” source.
Summary
The purpose of a poll is to identify how a population feels about an issue or candidate. Many polling companies and news outlets use statisticians and social scientists to design accurate and scientific polls and to reduce errors. A scientific poll will try to create a representative and random sample to ensure the responses are similar to what the actual population of an area believes. Scientific polls also have lower margins of error, which means they better predict what the overall public or population thinks. Most polls are administered through phones, online, or via social media. Even in scientific polls, issues like timing, social pressure, lack of knowledge, and human nature can create results that do not match true public opinion. Polls can also be used as campaign devices to try to change a voter’s mind on an issue or candidate.
| NOTE: The activities below will not be counted towards your final grade for this class. They are strictly here to help you check your knowledge in preparation for class assignments and future dialogue. Best of luck! |
Glossary
- Bradley effect
- the difference between a poll result and an election result in which voters gave a socially desirable poll response rather than a true response that might be perceived as racist
- exit poll
- an election poll taken by interviewing voters as they leave a polling place
- leading question
- a question worded to lead a respondent to give a desired answer
- margin of error
- a number that states how far the poll results may be from the actual preferences of the total population of citizens
- push poll
- politically biased campaign information presented as a poll in order to change minds
- random sample
- a limited number of people from the overall population selected in such a way that each has an equal chance of being chosen
- representative sample
- a group of respondents demographically similar to the population of interest
- straw poll
- an informal and unofficial election poll conducted with a non-random population
- Arthur Evans, “Predict Landon Electoral Vote to be 315 to 350,” Chicago Tribune, 18 October 1936. ↵
- United States Census Bureau. 2012. “Age and Sex Composition in the United States: 2012.” United States Census Bureau. http://www.census.gov/population/age/data/2012comp.html (February 17, 2016). ↵
- Rasmussen Reports. 2015. “Daily Presidential Tracking Poll.” Rasmussen Reports. September 27, 2015. http://www.rasmussenreports.com/public_content/politics/obama_administration/daily_presidential_tracking_poll (February 17, 2016); Pew Research Center. 2015. “Sampling.” Pew Research Center. http://www.pewresearch.org/methodology/u-s-survey-research/sampling/ (February 17, 2016). ↵
- American National Election Studies Data Center. 2016. http://electionstudies.org/studypages/download/datacenter_all_NoData.php (February 17, 2016). ↵
- Michael W. Link and Robert W. Oldendick. 1997. “Good” Polls / “Bad” Polls—How Can You Tell? Ten Tips for Consumers of Survey Research.” South Carolina Policy Forum. http://www.ipspr.sc.edu/publication/Link.htm (February 17, 2016); Pew Research Center. 2015. “Sampling.” Pew Research Center. http://www.pewresearch.org/methodology/u-s-survey-research/sampling/ (February 17, 2016). ↵
- “Roper Center. 2015. “Polling Fundamentals – Sampling.” Roper. http://www.ropercenter.uconn.edu/support/polling-fundamentals-sampling/ (February 17, 2016). ↵
- Gallup. 2015. “How Does the Gallup World Poll Work?” Gallup. http://www.gallup.com/178667/gallup-world-poll-work.aspx (February 17, 2016). ↵
- Gallup. 2015. “Does Gallup Call Cellphones?” Gallup. http://www.gallup.com/poll/110383/does-gallup-call-cell-phones.aspx (February 17, 2016). ↵
- Mark Blumenthal, “The Case for Robo-Pollsters: Automated Interviewers Have Their Drawbacks, But Fewer Than Their Critics Suggest,” National Journal, 14 September 2009. ↵
- Mark Blumenthal, “Is Polling As We Know It Doomed?” National Journal, 10 August 2009. ↵
- Frank Luntz. 2007. Words That Work: It’s Not What You Say, It’s What People Hear. New York: Hyperion. ↵
- Aaron Blake, “This terrible polls shows Elizabeth Warren beating Hillary Clinton,” Washington Post, 11 February 2015. ↵
- Nate Silver. 2010. “The Broadus Effect? Social Desirability Bias and California Proposition 19.” FiveThirtyEightPolitics. July 27, 2010. http://fivethirtyeight.com/features/broadus-effect-social-desirability-bias/ (February 18, 2016). ↵
- Nate Silver. 2010. “The Broadus Effect? Social Desirability Bias and California Proposition 19.” FiveThirtyEightPolitics. July 27, 2010. http://fivethirtyeight.com/features/broadus-effect-social-desirability-bias/ (February 18, 2016). ↵
- D. Davis. 1997. “The Direction of Race of Interviewer Effects among African-Americans: Donning the Black Mask.” American Journal of Political Science 41 (1): 309–322. ↵
- Kate Sheppard, “Top Texas Regulator: Could Russia be Behind City’s Proposed Fracking Ban?” Huffington Post, 16 July 2014. http://www.huffingtonpost.com/2014/07/16/fracking-ban-denton-russia_n_5592661.html (February 18, 2016). ↵
