
EME6613

Intro | Flowcharting | Storyboarding | Summary
Introduction
For this course, you are tasked with designing and developing a self-instructional web-based training/educational program. Dick, Carey, and Carey (2009, 2015) recommend that novice instructional designers begin by producing a self-instructional program (in other words, a course or training program that permits students to learn without any intervention from an instructor or fellow students). The authors’ reason that the development of a self-instructional program will focus your attention on key instructional events (e.g., motivation, content, practice, feedback, and assessment) that otherwise may be left to an instructor. They also note that the development of self-instructional materials will make it easier for you to complete a proceeding step in the systematic design processFormative Evaluation. I agree with both reasons. Thus, for this course, you are to flowchart and storyboard your self-instructional web-based instructional module.
Flowcharting and storyboarding are design tasks that are typically associated with the production of computer and web-based instruction. Instructional designers creating print or video-based training/educational programs do not often flowchart or storyboard their instruction prior to development. We will further discuss differences in developing print vs. video vs. computer-based instruction, as well as look at alternative design and development processes in the next phase and unit of the course. For now, let’s focus our attention on flowcharting and storyboarding.
[top]
Flowcharting
A flowchart is a graphical representation showing the flow of control among the steps in a program, people in an organization, or pages of a presentation. In the instructional design framework, flowcharts provide a birds-eye view showing the structure and sequence of a lesson (Alessi & Trollip, 1985). The elements themselves are represented by simple icons (circles, rectangles, diamonds, or other shapes) to allow the viewer to focus on the way the user will move through the steps in a process. Lines always represent connections between events, usually with arrowheads that show the direction or order in which they occur. A flowchart indicates sequences and decision points as well as starting and stopping points. It is much easier to grasp relationships visually in a flowchart than in a verbal description, therefore, these diagrams help us avoid leaving out steps in the process. Alessi and Trollip find that flowcharts are very useful for instructional designers who are, for the most part, novice or occasional programmers.
You may feel that, as an instructional designer, there is little if any need for you to learn about flowcharts. This is an incorrect assumption. Whatever area of instructional design or educational technology you go into, you will need to at least know how to read flowcharts. Here are two exemplary cases:
- Instructional designers use flowcharts to depict steps to follow when performing a task. Through the use of flowcharts, you can convey to someone else the steps and decisions someone performs when they do something. The symbols used are universal and they allow you to condense a lot of information into a little space.
- Computer programmers and software and multimedia designers use flowcharts to tell each other how the software works, what the user of a computer program needs to do (input), and what the computer does in response (output). Since educational software programs are usually designed to have lots of interactivity, allowing the user to choose among lots of different options, flowcharts are one of the best ways to communicate the branching concepts.
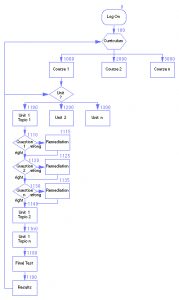
Figure 7.1 represents a flowchart created for computer-based instruction on safety. It illustrates how flowcharts can help to identify all the key tasks involved during instructional delivery. As you can see, the finished chart can be used:
- as a springboard for further discussion of the process;
- to connect with other flowcharts explaining related activities;
- to identify points where data can be usefully collected and analyzed;
- to isolate possible problem areas; and
- to communicate the process to those unfamiliar with it.
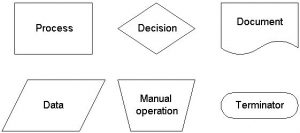
As can be seen in the example above, distinct shapes are used to represent different types of information. Figure 7.2 shows some of the shapes that may be used to communicate information about your instructional unit (Clemson University Department of Industrial Engineering, n.d.).
Producing a clear and detailed flowchart requires you to begin with a brief overview of the process (instruction) and progress to the level of detail that is necessary for your instruction. Simple lessons, such as tutorials, require little detail while complex lessons like simulations require considerably more. As stated earlier: the more time you spend on flowcharting, the less time you will spend later correcting program errors. However, flowcharts by themselves do not tell the entire story. Storyboards that depict each box in your flowchart are used to give developers a visual representation of each computer screen.
[top]
Storyboards
Because humans are primarily a visual species, a picture of a process conveys information more efficiently than writing or speaking about it. Someone reading the text-only description of the same process might not understand subtle interactions among various components. Making a process visible renders it easier to manage and thus improve (Walsh 1992). The combination of both flowcharts and storyboards provides the details necessary for computer programmers and other [multimedia] development and production specialists to review, improve and produce computer-based instruction.
Storyboarding provides an overall rough outline of what the presentation will look like, including which topics go where, the links, and a conceptual idea of where your images go, and what the layout will look like. It provides a visual representation of the user interface. With that representation in hand, you can develop each page in turn without trying to remember exactly where that page fits into the overall scheme.
You don’t have to be an artist to produce a storyboard. You only need to sketch in outlines. Use terms such as “this image goes in the top right-hand corner,” “this heading is level 2 and centered,” “this paragraph goes here,” “this page is a white background,” and “the navigation links go here” and so on. You can also draw all this in simple shapes with a few notes. You may even want to name the files you need for each page so you know which image or piece of text goes where. You may need to provide examples of things like house style for copy and image style and size for graphics to go with the storyboard. Ideally, someone should be able to look at your storyboard, no matter how crude, and using the right material, put together the same instructional site you would have. If you have a large unit to develop this can be very useful, allowing you to farm out work to others. From the storyboard, they should be able to layout the pages as you want them. When you assemble the project you should have consistently designed pages despite having several different authors.
Essentially, storyboards are meant to tell the story of each screen of computer-based instruction. They are meant to facilitate communications between the instructional designer and several different people. This communication is especially important when dealing with large-team development. Storyboarding is a significant process. One study showed that approximately 19% of the entire development time is spent creating and revising storyboards (Chapman, 1995).
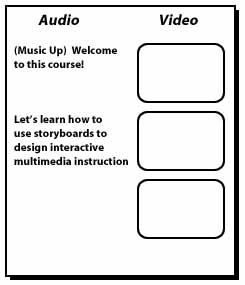
Storyboard formats from the past are inadequate for designing today’s interactive training. In the old days selecting a storyboard format was relatively easy because they only had to address a couple of variables. Early storyboards basically consisted of two columns: Audio and Video.
However, with the proliferation of highly interactive multimedia courses and presentations, the old storyboard format no longer works efficiently. Current and future multimedia training and education deal with much more than audio and/or video. Today’s courseware contains dynamic interactions, such as: animated technical drawings, learner control of video sequences, click-and-drag exercises, matching games, role-playing scenarios, free-play discovery exercises, virtual world navigation, etc.
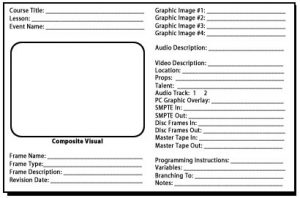
People creating interactive training in the early 1980s quickly discovered the inadequacies of the two-column storyboard. As a result, the concept of the “super storyboard” was born (Bergman & Moore, 1990). The idea of this approach was to create a document containing all of the information about each student interaction in as much detail as possible. Generally, each interaction was contained on one full page of the storyboard. Instead of the traditional two-column format, super storyboards contained information about every media element and programming logic used in the interaction as well as a visual representation of what the screen would look like. Part of the reason behind moving toward comprehensive storyboards was the notion that using storyboard forms and templates would speed up the scripting process. This proved to be correct. To be more descriptive, these storyboards contain dozens of fields related to media development and multimedia authoring. The fields found on these templates include information such as: event name, event description, graphic description, video description, video shot list information (location, subject, props, talent, etc.), SMPTE time code fields, on-screen touch areas, branching logic, programming notes, and many other related fields. Instructional developers complete the storyboard process by filling in the appropriate fields (Figure 7.4).
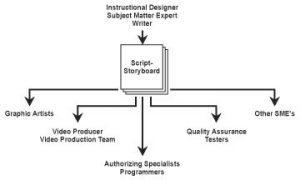
The three primary storyboard audiences are developers, graphic artists, and SMEs (subject matter experts). Storyboards must tell the developer everything they are supposed to program or build right down to the module title font, hyperlinks, and navigation of all buttons or other clickable objects. For graphic designers, they convey the story of what graphics are needed on a screen or as part of an animation. In fact, it is a good idea to create a separate list of what graphics are needed on what screen for production purposes. It is faster for the graphics person to refer to this list than to flip through the many storyboards that would make up a course.
For SMEs, storyboards are the main deliverable that they review and approve before programming begins. For this group, the storyboards must be crystal clear. It is not unheard of for SMEs to use their imagination when reviewing storyboards. And it is not unheard of for them to be surprised when they see the final product.
Storyboards are the blueprints of your interactive courseware design and development process. The more detailed they are, the better they are at fulfilling their communication and documentation roles. To be entirely effective, a storyboard must not be a passive document, rather it must take an active role in the development process. It must communicate the intended design to every member of the team. Making sure that your storyboards are complete and accurate can minimize questions that cause delays, assumptions that cause confusion, and errors that cause rework.
According to Varvel and Lindeman (2004), storyboarding consists of several steps:
- Organize all information and media elements (from Unit 6).
- Review rationale for materials choice (from Unit 6).
- Produce flowchart.
- Write preliminary text.
- Produce initial storyboards.
- Check the fit and appropriateness of displays and interactive elements.
- Check content elements for fit and appropriateness in the given context.
- Build information linkages.
- Review flowcharts and storyboards.
Draft Text and Thumbnail Illustrations
The amount of text that must be drafted at this stage depends on the details provided by designers as a result of the design phase of the systematic process. If detailed instructional treatment plans are generated specifying the actual text that is to be used during instruction, relatively little effort may be required at this stage. However, if only brief descriptions and/or outlines are contained in the instructional treatment plans, then a considerable amount of time and effort may be required to develop the instructional text. It is important to note that professional writers and/or editors are often hired to develop the final text that is to be included in self-instructional print materials. The roles and responsibilities of other development team members must also be considered. In any case, the text should be reviewed, revised, and edited to ensure clarity and consistency. The following guidelines are based on Smith and Ragan’s (1999, chap. 18) adaptation of Jones, Friedman, Tinzman and Cox’s (1984) work on writing instructional text.
- Keep sentences short, simple, and concise.
- Avoid the use of long introductory clauses and prepositional phrases.
- Make pronoun references clear and direct.
- Use active rather than passive voice.
- Use you to direct messages to learners.
- Use personal names and pronouns when possible.
- Use different attention-getting techniques (underline, bold, italics) to emphasize words or introduce new terms.
- Use headings to chunk text.
- Use transition words and sentences when appropriate.
- Check to ensure the text is free from gender, cultural, and social bias
- Check readability level to ensure appropriateness for target learners.
The advent of desktop publication software applications (e.g., Illustrator, PageMaker, QuarkXPress) has made it relatively easy for designers to draft text, design page layouts, and define text specifications all in one step. On the surface, combining steps through the use of technology may seem like a good way of reducing development time and overall costs. However, the problem is that designers can often overestimate the degree of completion on the basis of appearance. To avoid such pitfalls, I recommend that you use a word processor to draft text. Word processing applications also run faster and reduce the temptation to tweak appearance rather than working on meaning.
Illustrations should also begin with rough drafts referred to as thumbnails. Thumbnails can be hand-drawn sketches, photos, photocopies, computer screen dumps, clip art, and scanned images. Thumbnails should communicate your intent to such professionals, as well as help guide the design of your layout and the drafting of materials (see proceeding development stages). If your artistic talents are anywhere close to mine (which is pretty darn awful!), then you will need to hire a graphic artist and/or photographer to render the final copy of all illustrations. For the purposes of this course, thumbnails will be sufficient, particularly if no one on your design and development team has expertise in graphic arts. Do not go out and pay for professional illustrations just for this course.
The following guidelines are based on Smith and Ragan’s (1999, chap. 18) adaptation of Jones, Friedman, Tinzman, and Cox’s (1984) work on creating instructional illustrations.
- Ensure the instructional purpose of each illustration. Do not illustrate just for the sake of illustrating or breaking up text.
- Employ illustrations at the appropriate level of detail.
- Include familiar objects to enhance comprehensibility.
- Use separate illustrations to communicate before/after, right/wrong, and other comparisons or contrasts.
- Ensure consistency across illustrations (e.g., point of view, color, format).
- Place illustration close to related text.
- Ensure the relationship between text and illustrations is explicit using captions and references.
- Clearly label all illustrations.
- Provide a narrative description of illustrations to address guidelines specified by the American Disabilities Association.
- Focus attention to clarify complex illustrations (e.g., color, arrows).
[top]
Summary
In this supplemental reading, we have expanded upon what you read in Chapter 9 of the Dick, Carey & Carey (2015) text. You should now understand that flowcharts and storyboards are used to clearly display the structure and sequence of your planned instruction; that flowcharts use specific icons to represent your graphics, content, and functionality features; that storyboards are used to further convey the details of your instructional plan in a visual format; and that it is important to communicate your plan using a level of detail appropriate to the complexity of your instructional unit (e.g., the more complex the instructional plan, the more detailed your flowchart and storyboards should be).
Above all, you should now understand that the visual information you provide in a flowchart and series of storyboards should be sufficient to allow you to delegate instructional development work to a team of developers, communicate your graphic needs to graphic designers, and clearly convey your instructional plan to your SME and/or your client. This last step is especially crucial, as, without this clarity and detailed communication, it may be difficult to obtain funding and move forward through the development, implementation, and evaluation stages of the instructional design job.
With the knowledge you have acquired through the course textbook and this supplemental reading assignment, you should now be ready to proceed with Assignment 4. Be sure to post and respond to any questions you may have about A4 or about this unit in the appropriate areas of the course bulletin board system. Also, be sure to review the instructions and assessment criteria provided for A4 prior to submitting the assignment for instructor review.
[top]
Last Updated 08/19/22